


US Dollar Talking Points:
- The US Dollar has pulled back to short-term support following last week’s bullish breakout. The big question around USD for this week is whether buyers can continue to push as a bevy of data and drivers is on this week’s economic calendar.
- The Wednesday FOMC rate decision will likely garner considerable attention, but there’s high-impact US data every day this week with the exception of Thursday, and that’s when the Bank of England will take center-stage for a BoE Super Thursday.
- DailyFX Forecasts are published on a variety of currencies such as the US Dollar or the Euro and are available from the DailyFX Trading Guides page. If you’re looking to improve your trading approach, check out Traits of Successful Traders. And if you’re looking for an introductory primer to the Forex market, check out our New to FX Guide.
Do you want to see how retail traders are currently trading the US Dollar? Check out our IG Client Sentiment Indicator.
USD Breakout in the Spotlight During Heavy Week of Data
Last week brought the technical fireworks, starting with a breakdown in Gold prices that was soon followed by a breakout in the US Dollar. USD marched-up to fresh 22-month highs, and both EUR/USD and GBP/USD broke-down to fresh lows. The move in EUR/USD is particularly interesting as the pair pushed below a range that had been holding for almost six months prior. This includes a hold of support through some rather pensive issues, such as the Brussels-Rome debt stand-off, and the announcement of a fresh round of QE in March.
But last week’s break-down didn’t appear to have any singular driver governing the move, and this week’s busy economic calendar will provide ample ammunition to both bulls and bears to confirm or reverse the move.
The US Dollar is holding higher-low support at this point. This comes in at the first support zone looked at on Friday after the breakout took place. There are two Fibonacci levels of relevance, with the price of 97.86 is the 61.8% retracement of the 2017-2018 down-trend; and 97.94 is the 23.6% retracement of the 2014-2017 major move.
US Dollar Two-Hour Price Chart

Chart prepared by James Stanley
Taking a step back on the chart, and it becomes clear that this week is key to the current backdrop in the US Dollar. The currency had spent much of the previous five months building into an ascending triangle formation, and as looked at in the Q2 Technical Forecast for the US Dollar, this formation will often be approached in a bullish manner.
Click here to access the Q2 USD Trading Forecast DailyFX Q2 Forecast for USD.
That bullish breakout began last week and as looked at above, the currency is currently holding higher-low support, keeping the door open for topside continuation potential. But – this week’s economic calendar brings some big drivers to the table, and there remains ample opportunity for bulls to push to fresh highs as well as bears re-entering the picture to push back down into the prior range. There is high-impact US data on the docket for every day this week with the exception of Thursday, and that’s when the UK is on center-stage with a Super Thursday rate decision.
US Dollar Daily Price Chart

Chart prepared by James Stanley
EUR/USD Pulls Back from 22-Month Lows Ahead of Euro Inflation
Going along with that breakout in the US Dollar last week was a break-down in EUR/USD. The pair pushed down to fresh 22-month lows, testing below a batch of support that’s been in-play since November of last year.
I had looked at short-side stances in the pair coming into last week, and for this week, I looked at the potential for bearish continuation in EUR/USD. That prior zone of support now becomes resistance potential, and so far this week, EUR/USD is tip-toeing back towards this zone. Tomorrow brings German unemployment and inflation numbers to go along with Euro-Zone GDP; and then Friday brings Euro-Zone CPI numbers to provide a few different drivers around the single currency. Similar to the US Dollar above, each of these prints represents and opportunity for bears to continue showing their hands; either by pulling back on the throttle and allowing prices to re-enter the prior range, or by pressing further until fresh lows come into play.
EUR/USD Eight-Hour Price Chart
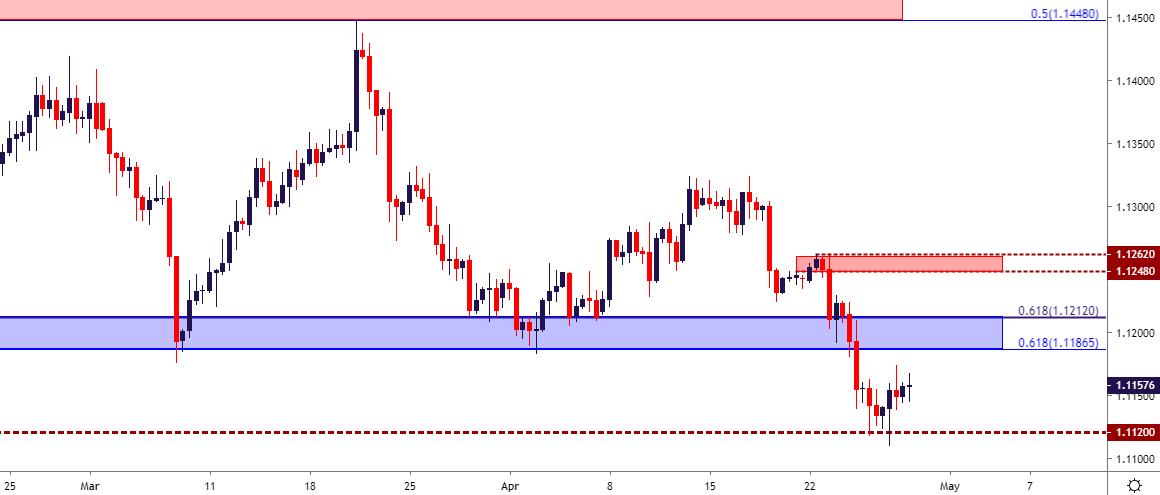
Chart prepared by James Stanley
AUD/USD Bounces from .7000 Big Figure: Range-Continuation in the Cards?
On the other side of the US Dollar, a few setups remain of interest. In this week’s FX Setups, I looked at backdrops in both USD/CHF and USD/CAD for similar purposes, and in this week’s Trading Forecast, I looked at AUD/USD.
Aussie has been range-bound for much of the year, and like many other major pairs, saw prices vulnerable to aggressive USD-moves last week. Range support came into play in the latter-portion of this week and, so far, has helped to hold the lows. This range support comes in around a long-term area of interest at the .7000 level. This price has had a tendency to provide support for quite some time, and while this is hardly a rigid level with which bears haven’t been able to test below, it has been a price that’s displayed a tendency to bring buyers back into the picture.
AUD/USD Weekly Price Chart

Chart prepared by James Stanley
On a shorter-term basis, price action in the pair has bounced up to another area of prior short-term support, taken from around the .7050-.7075 area on the chart, and this was an area that exhibited a few weeks of support during March and into April. A break-above the .7075 area will open up a move towards the next zone from .7125-.7150; and if that can be taken-out at some point this week, the .7185-.7206 area is re-opened after the earlier-month resistance inflection.
That would likely only come into play should US Dollar bulls pullback from the bid, allowing USD/DXY to drop back into the prior range. But – given the items on this week’s economic calendar, that’s a scenario that should at least be respected given our current backdrop.
AUD/USD Eight-Hour Price Chart

Chart prepared by James Stanley
To read more:
Are you looking for longer-term analysis on the U.S. Dollar? Our DailyFX Forecasts for Q2 have a section for each major currency, and we also offer a plethora of resources on USD-pairs such as EUR/USD, GBP/USD, USD/JPY, AUD/USD. Traders can also stay up with near-term positioning via our IG Client Sentiment Indicator.
Forex Trading Resources
DailyFX offers an abundance of tools, indicators and resources to help traders. For those looking for trading ideas, our IG Client Sentiment shows the positioning of retail traders with actual live trades and positions. Our trading guides bring our DailyFX Quarterly Forecasts and our Top Trading Opportunities; and our real-time news feed has intra-day interactions from the DailyFX team. And if you’re looking for real-time analysis, our DailyFX Webinars offer numerous sessions each week in which you can see how and why we’re looking at what we’re looking at.
If you’re looking for educational information, our New to FX guide is there to help new(er) traders while our Traits of Successful Traders research is built to help sharpen the skill set by focusing on risk and trade management.
--- Written by James Stanley, Strategist for DailyFX.com
Contact and follow James on Twitter: @JStanleyFX


