


Forex Talking Points:
- DailyFX Quarterly Forecasts for Q2 have been recently released, and are available directly from the following link: DailyFX Trading Guides, Q2 Forecasts.
- For trading ideas, please check out our Trading Guides. And if you’re looking for something more interactive in nature, please check out our DailyFX Live webinars.
- If you’d like more color around any of the setups below, join in our live DailyFX webinars each week, set for Tuesday and Thursday at 1PM Eastern Time. You can sign up for each of those sessions from the below link:
Tuesday: Tuesday, 1PM ET
Thursday: Thursday 1PM ET
Do you want to see how retail traders are currently trading the US Dollar? Check out our IG Client Sentiment Indicator.
US Dollar Trades to Fresh 2019 High: Time to Reverse or More to Go?
The US Dollar finally broke out. In last week’s FX Setups, I asked the question if this was going to be the week that US Dollar bulls took control. This comes after months of digestion with the currency building deeper into a symmetrical wedge pattern, and as looked at in the Q2 technical forecast on the US Dollar, this brought with it bullish potential for the US currency.
Now that prices have set that fresh 22-month high in the US Dollar, the big question is whether buyers will be able to continue the move. Making matters more interesting – next week’s economic calendar is absolutely loaded, with an FOMC rate decision on Wednesday, a Bank of England ‘Super Thursday’ rate decision on Thursday, and then Non-Farm Payrolls on Friday. And those are just the highlights, as the docket is littered with high-impact events that could compel workable price moves in a variety of venues. Below, I look into a series of price action setups across the US Dollar.
US Dollar Holds Resistance at 22-Month Highs

Chart prepared by James Stanley
Bearish EUR/USD on Hold Below 1.1262
Euro bears finally made their move: The range that had been building for the previous five months gave way as USD-strength and Euro weakness saw the world’s most popular currency pair break-down to a fresh 22-month low. I had looked into this scenario last week, initially just looking for a move back down to support; but with it came the potential for break-even stop moves that could allow for breakout plays.
Prices pushed down to support around the 1.1120 level, at which point a bit of grind began to develop. That grind held through the Friday open and prices began to tip-higher. This can keep the door open for a further retracement, targeting that prior zone of support for lower-high resistance. This week’s high set at 1.1262 can serve as a form of invalidation, and if that theme shows up, then we’re likely also looking at scenarios of USD-weakness, at which point other setups (such as USD/CHF or USD/CAD) looked at below could remain of interest.
EURUSD Eight-Hour Price Chart

Chart prepared by James Stanley
Bearish GBP/USD On Hold Below 1.3020
I started looking into short GBP/USD strategies a couple of weeks ago, attempting to anticipate this bearish breakout.
GBP/USD has displayed a similar backdrop of recent, as a round of digestion followed a big move. GBP/USD had a very strong first two months of the year, with volatility increasing around the March open in response to Brexit dynamics. But, as that theme cooled, so did GBP/USD volatility, and the pair then spent the next month building into a descending triangle formation. This type of pattern will often be approached with a bearish aim, looking for the same motivation that’s brought-in bears at lower-highs to, eventually, allow for a break through horizontal support.
That finally happened this week as USD broke-out to fresh 22-month highs, and GBP/USD continued all the way down to the first target looked at in last week’s FX Setups. This runs around the 1.2900 handle, as two different Fibonacci levels in close proximity offer an element of confluence.
And now that a bounce is developing, the potential for bearish trend continuation, and that prior zone of support from the descending triangle can now be re-utilized as potential resistance. This zone runs from 1.2960 up to 1.3000, and a hold of resistance here can open the door for bearish strategies with stops investigated above 1.3020. Target potential could remain around the same 1.2900, 1.2829, 1.2783 and, longer-term, the 1.2671-1.2721 zone.
GBP/USD Eight-Hour Price Chart
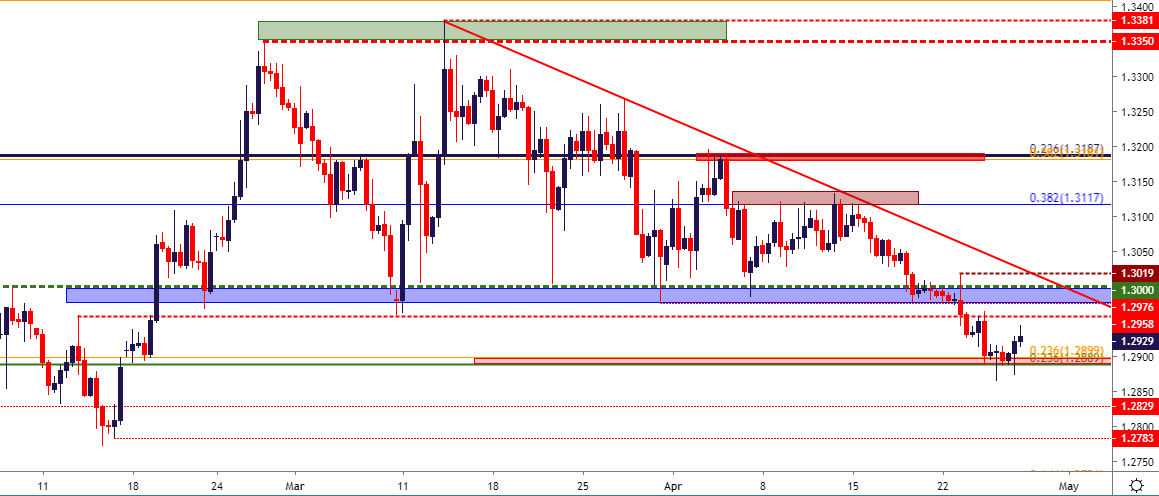
Chart prepared by James Stanley
Bearish USD/CHF: Reversal Potential on Hold Below 1.0250
It’s been a wild month in USD/CHF, as the pair pushed-higher off of a Fibonacci level at .9902 to rally up to fresh two-year-highs in a relatively short span-of-time. Prices in the pair tested above the 1.0200-handle this week, and this appears to be around where bears began to show up as Tuesday-Friday brought a continued show of resistance.
For traders looking to fade the US Dollar strength or, more to the point, for traders open to working with reversal scenarios, such a setup may exist in USD/CHF. Traders can investigate risk levels above the highs with targets directed towards the 1.0100 level. Break-even stop moves could be investigated at the first target, at which point secondary target potential exists around the parity level of 1.0000.
USD/CHF Daily Price Chart
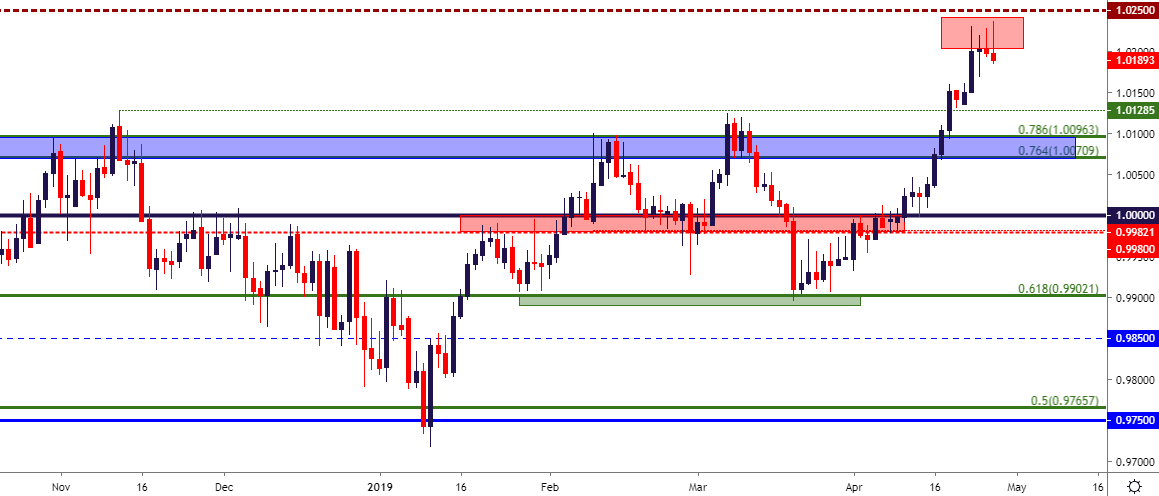
Chart prepared by James Stanley
USD/CAD Finds Resistance at 1.3500, Builds Reversal Potential
I had tried to catch the short side of USD/CAD last week, but that didn’t work as both USD-strength and CAD-weakness propelled the pair up to fresh three-month-highs. But what did show up soon after was a hit of resistance at the 1.3500 handle, and prices have since started to show tendency for reversal.
This can re-open the door for bearish strategies, and traders looking at risk levels above the three-month-high could couple that with an initial target around the 1.3385 level to aim for a better than 1-to-1 risk-reward ratio.
USD/CAD Daily Price Chart
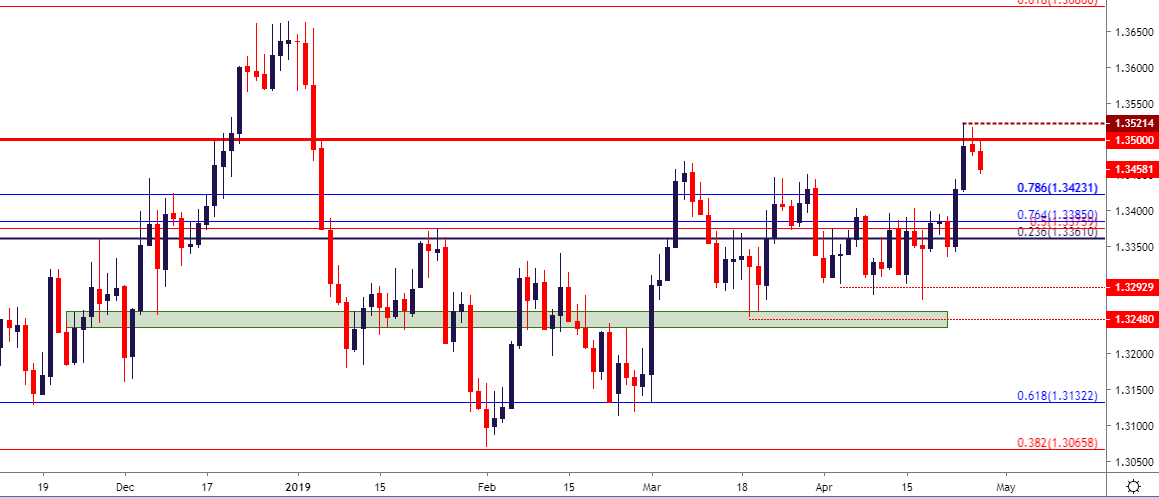
Chart prepared by James Stanley
To read more:
Are you looking for longer-term analysis on the U.S. Dollar? Our DailyFX Forecasts for Q4 have a section for each major currency, and we also offer a plethora of resources on USD-pairs such as EUR/USD, GBP/USD, USD/JPY, AUD/USD. Traders can also stay up with near-term positioning via our IG Client Sentiment Indicator.
Forex Trading Resources
DailyFX offers an abundance of tools, indicators and resources to help traders. For those looking for trading ideas, our IG Client Sentiment shows the positioning of retail traders with actual live trades and positions. Our trading guides bring our DailyFX Quarterly Forecasts and our Top Trading Opportunities; and our real-time news feed has intra-day interactions from the DailyFX team. And if you’re looking for real-time analysis, our DailyFX Webinars offer numerous sessions each week in which you can see how and why we’re looking at what we’re looking at.
If you’re looking for educational information, our New to FX guide is there to help new(er) traders while our Traits of Successful Traders research is built to help sharpen the skill set by focusing on risk and trade management.
--- Written by James Stanley, Strategist for DailyFX.com
Contact and follow James on Twitter: @JStanleyFX


