


US Dollar Talking Points:
- The economic calendar over the next two days brings a couple of rate decisions: At 2PM ET tomorrow, the last FOMC meeting that’s not expected to be a ‘live meeting’ at the Fed. December is a quarterly rate decision that will bring an updated dot plot to go along with new projections and an accompanying press conference. And then starting next year – any FOMC rate decision could be a ‘live meeting’ and will bring an press conference with Fed Chair, Jerome Powell.
- The Dollar has dropped down to a confluent area on the chart following yesterday’s mid-term elections in the US. Democrats gained a majority in the House while the GOP increased their majority in the Senate. Focus now shifts towards the 2020 Presidential Election, and markets appear optimistic around yesterday’s outcome at the early stage of the matter as equity futures have moved-higher overnight and appear poised to gain at the open.
- DailyFX Forecasts on a variety of currencies such as the US Dollar or the Euro are available from the DailyFX Trading Guides page. If you’re looking to improve your trading approach, check out Traits of Successful Traders. And if you’re looking for an introductory primer to the Forex market, check out our New to FX Guide.
Do you want to see how retail traders are currently trading the US Dollar? Check out our IG Client Sentiment Indicator.
US Dollar Drops to Trend-Line Support Following US Mid-Terms
The results of 2018 mid-terms are still being tallied in a couple of races but for most intents and purposes, the results are in. Democrats took the house while the GOP increased their Senate majority, and focus now shifts towards the 2020 Presidential Election in what will almost surely be billed as another ‘most important election of our lifetimes’. Markets have put in some interesting moves in response, as the risk trade caught another shot-in-the-arm and global equity markets are in varying forms of bounce; and the US Dollar caught a stern run of selling to drop down to two-and-a-half week lows as risk appetite showed more prominently through the FX space.
At this point, the Dollar appears to be trying to hold support on a trend-line projection that can be found by connecting the September and October swing lows in the currency. This current support is also confluent with the 61.8% Fibonacci retracement of the bullish breakout from October.
US Dollar Two-Hour Price Chart: Trend-Line, Fibonacci Support Hold Lows Ahead of FOMC

Chart prepared by James Stanley
As I’ve been discussing in webinars over the past month, themes of USD-strength and weakness have appeared to be unevenly distributed amongst major currency pairs. While EUR/USD retains some bearish structure on the four-hour chart, pairs like AUD/USD and NZD/USD are trading at fresh monthly highs; and this comes after each of those pairs built-in and held key support during the US Dollar’s prior topside run. This can help to denominate strategy in the Greenback moving forward, and I look into a series of major pairs below.
EUR/USD Tests Resistance – Italian Budget Due Next Week
One of the larger items of risk aversion over the past couple of months is the continuing situation between Italy and Brussels. The European Commission rejected Italy’s budget proposal in October. Italy is now supposed to re-submit a revised budget by November 13th, and a bit of suspense remains here as markets still don’t know whether the newly-elected Italian government will cave to the EC’s requests.
This theme has been a source of Euro pain for a chunk of this year already, as the currency went into a swan-dive in April and May as the government was being elected, and then again in late-September into early-October as budget concerns were coming to light.
EUR/USD Four-Hour Price Chart: A Strong November as Prices Re-Test 1.1500 Resistance

Chart prepared by James Stanley
Cable Rips Back Above 1.3000
Brexit waves continue to push price action in the British Pound, and the bid has been active thus far in November trade as GBP/USD has jumped by more than 450 pips in the early portion of this month. Along the way a number of key levels have been tested and then taken out, and prices are now finding some resistance at 1.3164, which is the 50% marker of the 2016-2018 topside move in the pair. This also projects around the descending trend-line taken from September and October swing-highs.
Given the volatility in GBP/USD over the past few months, it would appear that Brexit may have a bit more pull than just standard USD trends, as this was somewhat of a hyperbolic USD move. As the Dollar was really strong through October, GBP/USD was extremely weak, as risk around Brexit added-on to those Dollar gains and this pushed GBP/USD down towards yearly lows. But as USD-weakness has showed up over the past week, optimism around Brexit has added on to that theme and the pair has posed a stern topside move back above the key 1.3000 area.
This could add an item of risk to USD-strategies traded through GBP/USD, as we likely haven’t seen the end of volatility around the British Pound as Brexit negotiations will probably continue to push prices in either direction.
GBP/USD Daily Price Chart: An Even Stronger November as GBP/USD Jumps Above 1.3000
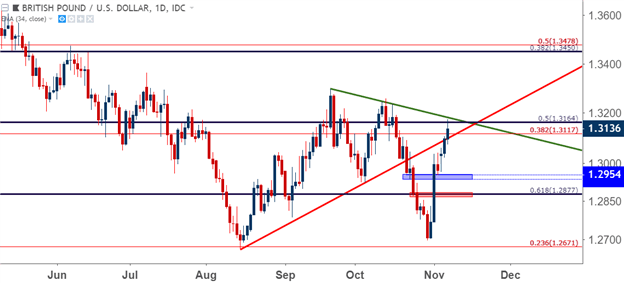
Chart prepared by James Stanley
AUD/USD Breaks Trend-Line Resistance, Runs to Fresh Monthly Highs
During the US Dollar’s topside run last month, I began to look at the longer-term support build in AUD/USD. While the pair had spent most of 2018 in some form of down-trend, adhering to a bearish trend-line for much of the period, October brought respect of lows above the .7000 level and, even as USD strength was running vividly elsewhere, it seemed to dry up against the Australian Dollar.
Coming into November, I began to look at topside plays in the pair, and as USD-weakness has come back, AUD/USD has put in a fairly bullish past week of price action. This has brought along a break of the 2018 bearish trend-line, another re-load of higher-low support at prior resistance, followed by fresh monthly highs in the pair. This can remain attractive for strategies designed around further USD-weakness; and in AUD/USD, that could open the door for higher-low support around the .7250 area of prior resistance.
AUD/USD Eight-Hour Price Chart: Bulls Take Control, Higher-Low Support Potential Around Prior Resistance
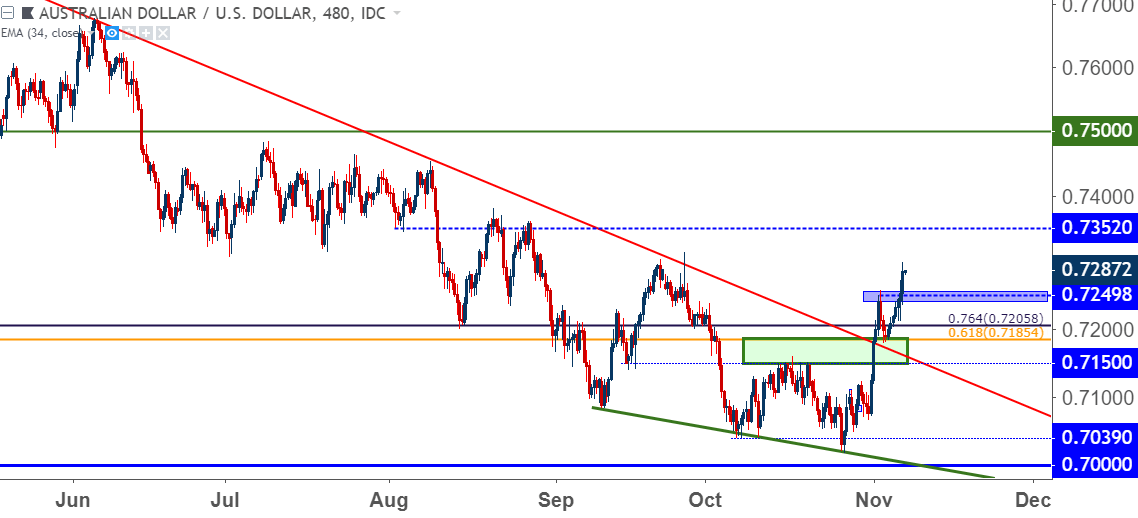
Chart prepared by James Stanley
NZD/USD Jumps to Three-Month-Highs
Similar to AUD/USD above, NZD/USD had a relatively strong October considering the strength that was seen in the US Dollar. While the Greenback was jumping up to fresh yearly-highs, NZD/USD retained its own bullish structure and respect of prior support. In late-October, as USD was rushing up to fresh highs, NZD/USD held higher-low support around the .6500 handle.
And as that USD theme softened, NZD/USD lifted off of support, breaking above a symmetrical wedge pattern in the process. As USD-weakness has grown a bit more prominent, that topside move in NZD/USD has continued to drive-higher, now bringing on fresh three-month-highs in the pair.
At this stage, the pair might be a little too hot to try to buy, particularly given that prices remain perched near three-month-highs. But – there is an area of prior resistance that retains interest for higher-low support, and that takes place around the .6700 handle that was broken-through without so much as a pause yesterday.
Also of note – there is an RBNZ rate decision lurking on the calendar for later today, ahead of the November rate decision from the Federal Reserve, set to take place tomorrow.
NZD/USD Eight-Hour Price Chart
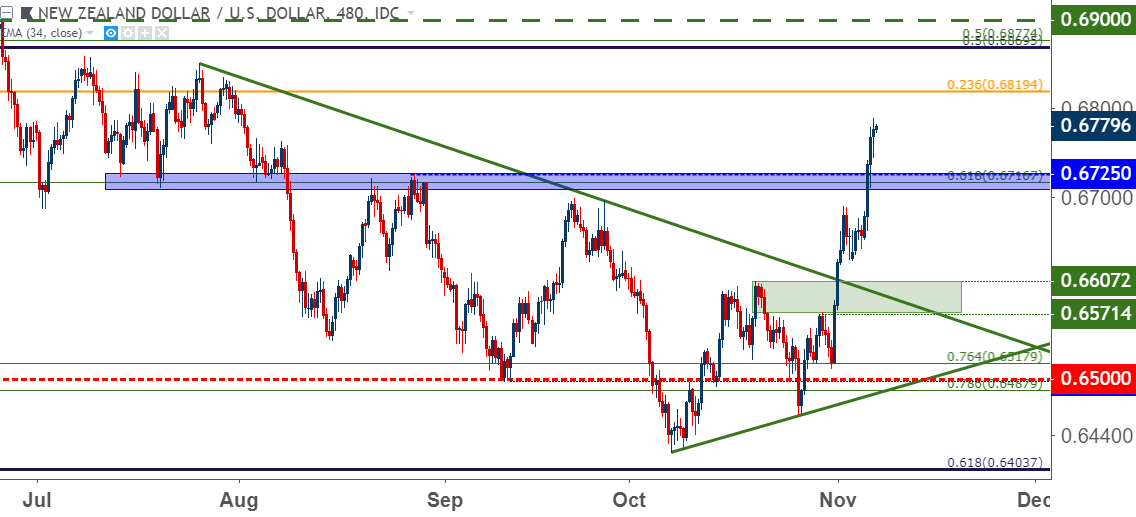
Chart prepared by James Stanley
To read more:
Are you looking for longer-term analysis on the U.S. Dollar? Our DailyFX Forecasts for Q4 have a section for each major currency, and we also offer a plethora of resources on USD-pairs such as EUR/USD, GBP/USD, USD/JPY, AUD/USD. Traders can also stay up with near-term positioning via our IG Client Sentiment Indicator.
Forex Trading Resources
DailyFX offers a plethora of tools, indicators and resources to help traders. For those looking for trading ideas, our IG Client Sentiment shows the positioning of retail traders with actual live trades and positions. Our trading guides bring our DailyFX Quarterly Forecasts and our Top Trading Opportunities; and our real-time news feed has intra-day interactions from the DailyFX team. And if you’re looking for real-time analysis, our DailyFX Webinars offer numerous sessions each week in which you can see how and why we’re looking at what we’re looking at.
If you’re looking for educational information, our New to FX guide is there to help new(er) traders while our Traits of Successful Traders research is built to help sharpen the skill set by focusing on risk and trade management.
--- Written by James Stanley, Strategist for DailyFX.com
Contact and follow James on Twitter: @JStanleyFX


