


Talking Points:
- US midterm elections’ results are due out over the next several hours, starting at 18 EST/23 GMT on Tuesday, November 6 and running through at least 1 EST/6 GMT on Wednesday, November 7.
- Expectations for an immediate reaction across markets may be low due to the forecast of impending fiscal gridlock returning to Washington, DC.
- The US Dollar remains on mixed but slightly favorable footing, according to the IG Client Sentiment Index.
See our long-term forecasts the US Dollar and other major currencies with the DailyFX Trading Guides.
The 2018 US midterm election cycle is winding down. Election results will start to trickle out starting at 18 EST/23 GMT on Tuesday, November 6 and will continue well through the evening, until at least 1 EST/6 GMT on Wednesday, November 7. Even then, due to widespread expectations of close races in key House and Senate races, it’s very possible that when European or even North American traders get to their desks on Wednesday, the composition of the US Congress still won’t be fully known.
We’ve already covered expectations for what to expect out of the US midterm elections. While the prospect of fiscal gridlock portends to a limited market reaction initially – not just in FX, but in bonds, commodities, and equities as well – it’s important for traders to focus on ‘big picture’ issues: forecasts for key currencies beyond the midterm elections, as well as key themes that have been and will continue to influence trading decisions. Here’s what we’re watching for on the other side of Tuesday.
How Will the Election Change the Course of the US-China Trade War?
While the elections will stir deep emotions in both the United States and globally, the material impact the event has on systemic economic and financial themes is far less distinct. One of the greatest ongoing threats to global growth remains the world’s protectionist shift, steered in particular by the United States-led trade war. While the metals tariffs the country placed on many trade partners and the lingering threat of a fracture in relations with the European Union and Japan are serious concern, the relentless escalation in the economic war between the US and China stands as the most overt cinch on the growth and financial health.
Looking through the various possible outcomes for the mid-term elections, there can certainly be a measure of course correction on the degree of combativeness the US government may be willing to ply against their counterparts. For example, a Democrat held Congress could work against the President’s efforts to apply pressure to closer economic allies in Europe or Japan. However, they will not be able to completely scuttle the effort; the president retains significant powers to negotiate on trade, regardless of the composition of Congress thanks to the 1934 Reciprocal Trade Act.
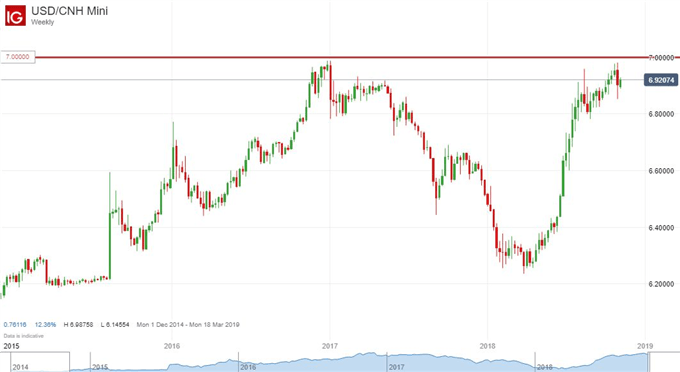
USD/CNH Price Chart: Weekly Timeframe (January 2015 to November 2018) (Chart 1)
As for the campaign to keep the pressure on China, there will be less political will to fight from either party to curb the President’s aggression as it could be seen as favorable optics to either support domestic employment or prevent a superpower from leapfrogging the rest of the world using questionable trade practices. That said, the threat that this path poses is extreme. Should a crisis develop in China owing to the trade war, it will readily turn contagious and sweep the world. Even if the world’s two largest economies are able to beat back the bigger threats, there are third parties that can still find themselves slipping into financial instability – such as emerging markets.
Keep an eye on the 7.0000 level of USD/CNH. This is the supposed ‘red line’ for which Chinese officials have defended further depreciation in their currency. If the market continues through that symbolic figure, it is either indication that China is willing to risk the perspective of capital flight in order to use an unorthodox policy tool to fight back against a tariff scale it can’t keep pace with. Or it could be an indication that they simply cannot contain the market. Neither would be an encouraging sign. – John Kicklighter, Chief Strategist
Where Does the Euro Go From Here as Italian Concerns Linger?
Last week, EUR/USD found itself rejected from an area of resistance near the 1.1450 level, where a confluence of levels and lines lie. The rejection has so far been short-lived with EUR/USD holding and rebounding a bit yesterday. This has in focus the potential for an inverse head-and-shoulders pattern.
EUR/USD Price Chart: 4-hour Timeframe (September to November 2018) (Chart 2)
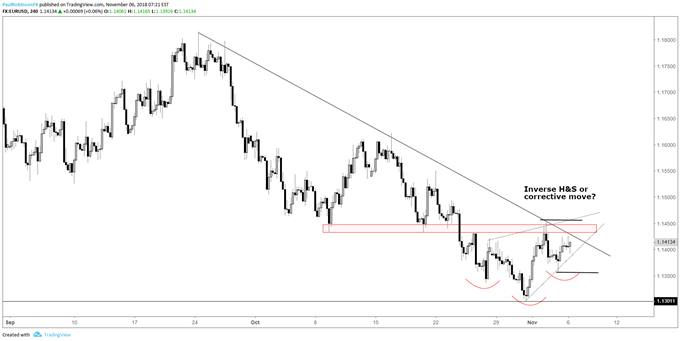
On the flip-side, the trend since September has been decisively negative, and with resistance thus far keeping a lid on the Euro price action could merely be corrective in an ongoing downtrend. With a catalyst upon us we should know real soon which way this situation wants to resolve.
EUR/USD Price Chart: Daily Timeframe (January to November 2018) (Chart 3)
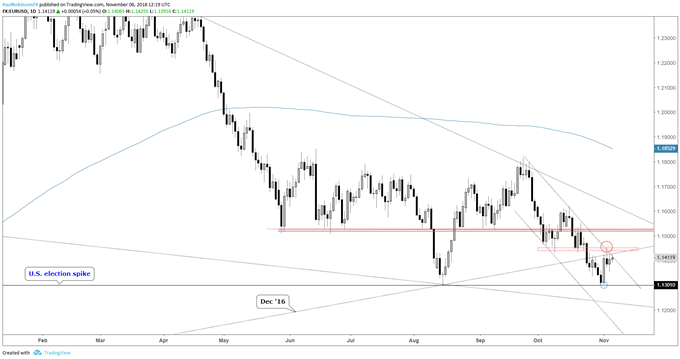
A sustained move above 1.1456 will confirm the inverse H&S scenario, but will quickly bring into play a familiar barrier in the low-1.1500s. Whether that can be crossed or not is to be seen. A breakdown under 1.1355 will give the upper hand to the correction scenario and likely bring into play the important 11300 level, which interestingly enough, was first forged as an important level following the results of the U.S. Presidential election in 2016. A break below could trigger sell orders and send the Euro down rather quickly from there. – Paul Robinson, Analyst
How Quickly Do Traders Spot Shifting Fed Narrative?
One of the accepted facts in the financial media zeitgeist is that rising interest rates at the start of October triggered the global equity market selloff. The Federal Reserve itself has been fingered as the main culprit, given Fed Chair Jerome Powell’s stated belief that the neutral policy rate was higher than previously anticipated – in effect, saying that the economy could withstand more rate hikes than priced-in.
But as the US midterm elections have come into focus, the Fed has shifted out of the frame and machinations around their policy expectations have likewise faded from view. Yet even as it is widely believed that the Fed will continue hiking rates by 25-bps every three months – March, June, September, and December – it now appears that rates markets are starting to price in the end of the Fed hike cycle around the corner.
Eurodollar 2019/2020 Spread: Daily Timeframe (January to November 2018) (Chart 4)
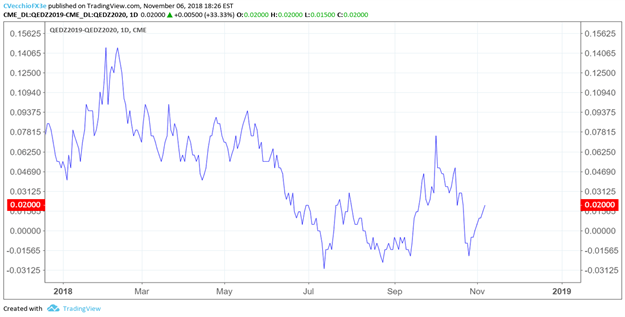
The spread between the Eurodollar 2019 and 2020 contracts recently fell to zero, in effect saying that there would be no difference between the Fed’s main rate at the end of 2019 and its main rate at the end of 2020. For some time earlier in October, the Eurodollar 2019/2020 spread dipped into negative territory, which was a sign that rates markets were signaling the end of the Fed hike cycle in December 2019 and a rate cut coming in 2020.
One of the main narratives for market volatility has been rising interest rates. But once attention shifts away from politics and back to economics, the Fed will quickly return to the forefront. Traders shouldn’t dismiss the impact that the perception the end of the Fed hike cycle coming into view will have on risk appetite, particularly as the calendar turns to the new year and the conversation shifts from “a rate cut in 2020 is possible” to “a rate cut next year is possible” – an entirely different psychological framework than what we’ve been hearing for the past few years. – Christopher Vecchio, CFA, Senior Currency Strategist
Options Markets Like USD/JPY’s Potential, Even if Volatility Expectations are Low
Across FX markets, a currency pair to place close attention to is USD/JPY with option markets suggesting that most activity could be seen in the pair as overnight expiry option vols attach a break-even of 78pips. However, relative to the 2016 election, event risk premiums for the midterm election through overnight expiry options are notably lower. Consequently, this suggests that option markets are not pricing in a large FX reaction. Potentially this could be on the basis that dealers are either assured of the outcome or underpricing the risk of the event.
USD/JPY Overnight Volatility: Daily Timeframe (February 2015 to November 2018) (Chart 5)
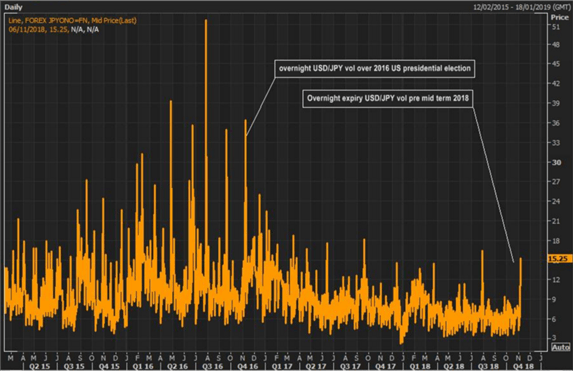
As it stands, polling data suggests that the midterm election may lead to a split Congress with the Republican party keeping the Senate, however, losing the House of Representatives to the Democratic party. If indeed this is the case, this could see the Japanese Yen benefit against the US Dollar as a split Congress would not only increase the political uncertainty in the US but also provide more hurdles for President Trump to pass through his domestic agenda (further tax cuts, although there may be some common ground on infrastructure), which in turn may weigh on the US Dollar and US equity markets. – Justin McQueen, Analyst
Will the German-US Yield Spread Reverse its Momentous Climb?
One chart to watch will be the spread – or difference in yield – between the US Treasury 10-year yield and the German Bund 10-year yield, which is regarded as the benchmark for Eurozone government bonds in general. The yield spread has been rising throughout this year against a background of a rising federal funds rate at a time when Eurozone monetary policy is expected to be on hold through the summer of next year.
US-German 10-year Yield Spread: Daily Timeframe (January to November 2018) (Chart 6)
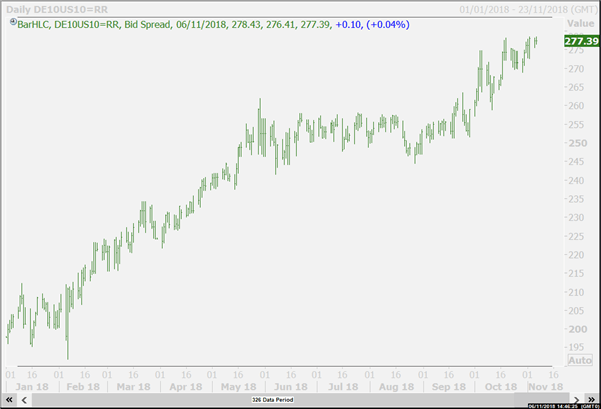
If the polls are right and the Democrats win the House but fail to win the Senate, or if the Republicans hold on to both, a further easing of US fiscal policy is likely. That, in turn, would likely keep intact expectations of further increases in the federal funds rate and potentially widen the spread still further.
After a period of stability over the summer months, the spread has climbed again so far this Fall and a three percentage point gap is now possible unless the Democrats win both houses of Congress and put a break on Trump’s tax cuts. In that case a drop back towards the summer levels around 2.500% (seen from May through September this year) could be back in the cards – a scenario that would make it easier for EUR/USD to rally into the end of the year. – Martin Essex, MSTA, Analyst & Editor
FX TRADING RESOURCES
Whether you are a new or experienced trader, DailyFX has multiple resources available to help you: an indicator for monitoring trader sentiment; quarterly trading forecasts; analytical and educational webinars held daily; trading guides to help you improve trading performance, and even one for those who are new to FX trading.
--- Written by John Kicklighter, Chief Strategist, Christopher Vecchio, CFA, Senior Currency Strategist, Martin Robinson, MSTA, Analyst & Editor, Paul Robinson, Market Analyst, and Justin McQueen, Analyst


