Forex Talking Points:
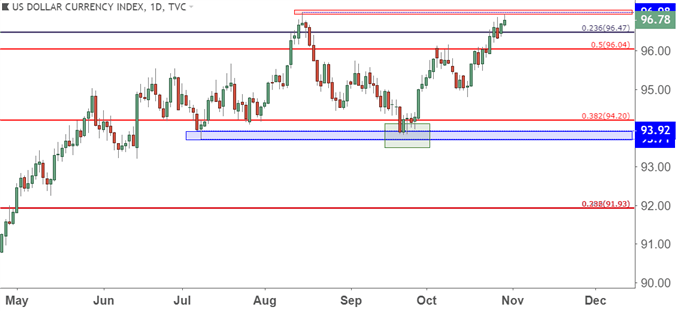
- US Dollar Strength has continued to show and the Greenback is pulling back just shy of a re-test of the prior 2018 high. This was set in mid-August, after which prices ran down to Q3 support. But the most recent FOMC meeting on September 26th appeared to start a spate of USD strength that really began to hasten in mid-October as risk aversion and equity weakness began to garner attention.
- EUR/USD and GBP/USD have both put in very visible down-side runs, and the concern at this point is short-term oversold dynamics after considerable stretch from the past two weeks. One pair may be set up a bit more attractively for reversal potential while the other appears to have a building backdrop of bearish continuation. The below articles look into each.
- DailyFX Forecasts on a variety of currencies such as the US Dollar or the Euro are available from the DailyFX Trading Guides page. If you’re looking to improve your trading approach, check out Traits of Successful Traders. And if you’re looking for an introductory primer to the Forex market, check out our New to FX Guide.
Do you want to see how retail traders are currently trading the US Dollar? Check out our IG Client Sentiment Indicator.
US Dollar Strength Moves Closer to Challenge of the 2018 High
US Dollar bulls are continuing to push and the US currency is fast nearing a re-test at the 2018 high. This shows just inside of the 97.00 level, and this was last tested in mid-August as worries around Turkey’s economy was heating up. As concerns of contagion grew around European banking from exposure to Turkish situation, EUR/USD dropped down to a low around 1.1300 and the US Dollar pushed up towards 97.00. The second half of August saw that fear take a back seat as the risk trade returned, with the US Dollar falling back to early-Q3 support.
But the past month has finally brought a defined trend into the mix, as US Dollar bulls have continued to push from that prior Q3 support all the way up to the 2018 high.
US Dollar Daily Price Chart: From Q3 Support to 2018 Highs

Chart prepared by James Stanley
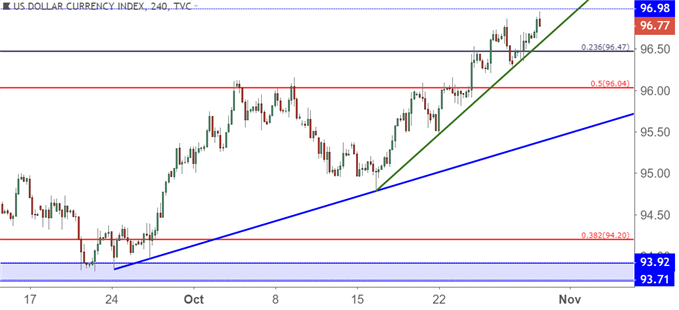
That topside move in the US Dollar has really appeared to hasten over the past two weeks, and this can be illustrated by a more-aggressively sloped trend-line that’s developed around price action support since around mid-October. This syncs up fairly well with the recent bout of risk aversion permeating through global equity markets, but this might not be the sole source of this strength. The last Fed meeting was on September 26th, and this is around where the first bullish trend-line started, shown in blue on the below chart. Mid-October is around when equity weakness really started to get attention, and this marks the start of the second, more-aggressively sloped trend-line shown in Green on the below chart.
US Dollar Four-Hour Price Chart: A Two-Pronged Push as Strength Hastens with Risk Aversion Themes

Chart prepared by James Stanley
Euro Weakness Continues, EUR/USD Stops Shy of Prior 1.1300 Support
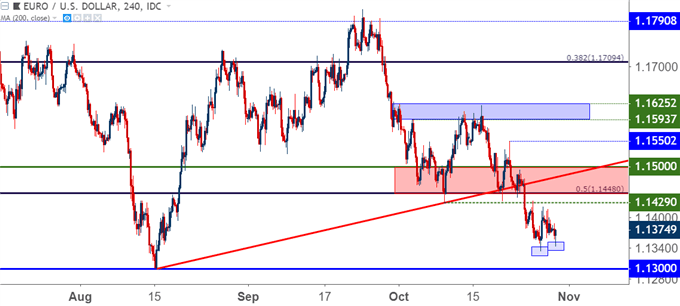
Contributing to that topside push in the US Dollar is the continued sell-off in EUR/USD. Sellers have thus far stopped short of the prior August swing-low around the 1.1300 handle, and this produces a difficult backdrop for on-loading new positions. Sellers have remained persistent upon tests of highs but, upon re-tests of lows, that same aggression hasn’t been seen. This may be spelling retracement potential in EUR/USD before that 1.1300 level can be re-tested again, and this opens the door for a couple of points of interest for lower-high resistance potential.
The price of 1.1430 was a prior swing low that held support on two separate tests earlier in October. A bit higher, there’s the 1.1448 50% marker of the 2017-2018 up-trend in the pair, and just beyond that, at 1.1500 is a major psychological level. This is a big batch of prior support potential that could open the door for bearish trend strategies in the pair should that retracement develop.
Outside of that, traders could look to breaches of the low for bearish breakout strategies.
EUR/USD Four-Hour Price Chart: Sellers Getting Shy Around Prior Lows

Chart prepared by James Stanley
GBP/USD Approaching 2018 Low, 23.6% Fibonacci Support
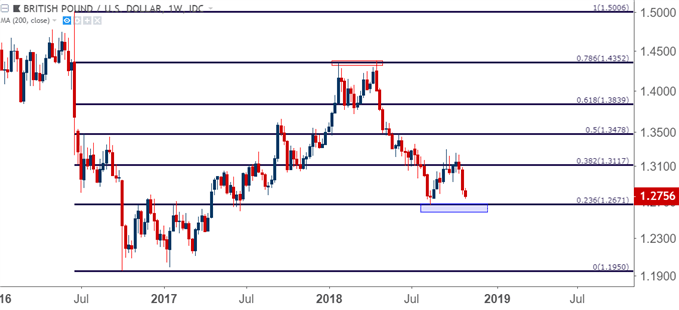
A similar move of continuation has shown thus far on the new week in the British Pound. The pair broke below a symmetrical wedge pattern last week, then flickered up to a lower-high resistance tests before bears took control to drive down to fresh two month lows.
But prices are fast nearing a key point on the chart that could make strategies of continuation a challenge. This level takes place at 1.2671, and this is the 23.6% Fibonacci retracement of the 2016-2018 major move. This is the same Fibonacci study that helped to mark the top in the pair in January and again in April, and this level coming back into play could thwart bearish approaches while starting to open the door for reversal potential as the Dollar approaches its own key point on the chart at 97.00.
GBP/USD Weekly Price Chart: Heading Towards Re-Test of 2018 Low at 23.6% Fibonacci Retracement

Chart prepared by James Stanley
To read more:
Are you looking for longer-term analysis on the U.S. Dollar? Our DailyFX Forecasts for Q4 have a section for each major currency, and we also offer a plethora of resources on USD-pairs such as EUR/USD, GBP/USD, USD/JPY, AUD/USD. Traders can also stay up with near-term positioning via our IG Client Sentiment Indicator.
Forex Trading Resources
DailyFX offers a plethora of tools, indicators and resources to help traders. For those looking for trading ideas, our IG Client Sentiment shows the positioning of retail traders with actual live trades and positions. Our trading guides bring our DailyFX Quarterly Forecasts and our Top Trading Opportunities; and our real-time news feed has intra-day interactions from the DailyFX team. And if you’re looking for real-time analysis, our DailyFX Webinars offer numerous sessions each week in which you can see how and why we’re looking at what we’re looking at.
If you’re looking for educational information, our New to FX guide is there to help new(er) traders while our Traits of Successful Traders research is built to help sharpen the skill set by focusing on risk and trade management.
--- Written by James Stanley, Strategist for DailyFX.com
Contact and follow James on Twitter: @JStanleyFX


