


Pre-NFP Price Action Setups Across the US Dollar
It’s been a feast and then famine type of week across the US Dollar, as the continuation of a strong topside breakout from October ran up to fresh yearly highs through yesterday’s US session. But, as soon as the page started to turn into November, a rather visible reversal developed that’s seen most of the past week’s gains erased. The horizon is full of risk events, so we’re likely in for continued volatility over the next week as today after market close brings Apple (AAPL) earnings, and this will likely carry a bearing on US equity markets as tech has come under fire during the October sell-off. Tomorrow brings Non-Farm Payrolls, and next Tuesday brings mid-term elections in the United States. And if that’s not enough, FOMC is waiting in the wings for next Wednesday.
In this webinar, I looked at a variety of setups across USD pairs, and then closed the session by looking at equity indices in the S&P 500, Dow Jones and German DAX.
US Dollar Talking Points:
- If you’re looking to improve your trading approach, our Traits of Successful Traders research could help. This is based on research derived from actual results from real traders, and this is available to any trader completely free-of-charge.
- If you’re looking for a primer on the FX market, we can help. To get a ground-up explanation behind the Forex market, please click here to access our New to FX Trading Guide.
If you’d like to sign up for our webinars, we host an event on Tuesday and Thursday, each of which can be accessed from the below links:
Tuesday: Tuesday, 1PM ET
Thursday: Thursday 1PM ET
US Dollar Bulls Feast, Then Run Into November Famine
In Tuesday’s webinar, I focused-in on the US Dollar as the currency was inching closer to fresh 2018 highs. I had mentioned that this would likely show during the webinar, which it did, and this led into another day of strength as the currency continued to push-up towards fresh yearly highs. That lasted into last night’s Tokyo open, but since then, something very different has started to show.
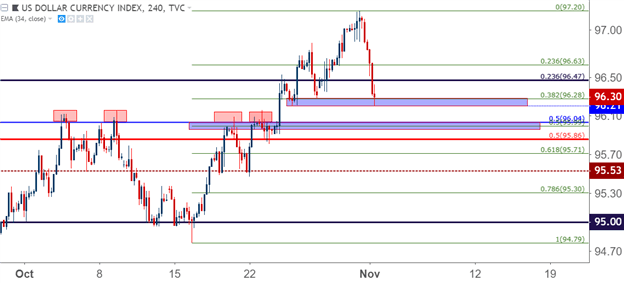
Bearish momentum has been the name of the game for the past 16 hours or so, and that move has seen the entirety of the past week’s gains in the Greenback taken-out. Prices are testing an area of support that I looked at earlier this morning, and this comes from the 38.2% Fibonacci retracement of the two-week bullish move in DXY, and another confluent zone exists around the 96.00 handle, as there are a number of Fibonacci levels within near proximity of each other. This can keep the door open for USD-strength, but as I’ve been saying, picking spots is important here as those US Dollar themes have taken on an uneven distribution over the past month.
EUR/USD may remain attractive for long-USD setups, as prices in the pair retain some bearish structure. GBP/USD, however, may not be so attractive for short-side strategies as today’s rip-higher has been significant and blown by a number of potential resistance levels. And those pairs I’ve been following for USD-weakness remain attractive in AUD/USD and NZD/USD.
US Dollar Four-Hour Price Chart: Testing Support After Pullback From Fresh Yearly Highs
EUR/USD Stops Short at 2018 Low, Begins to Bounce
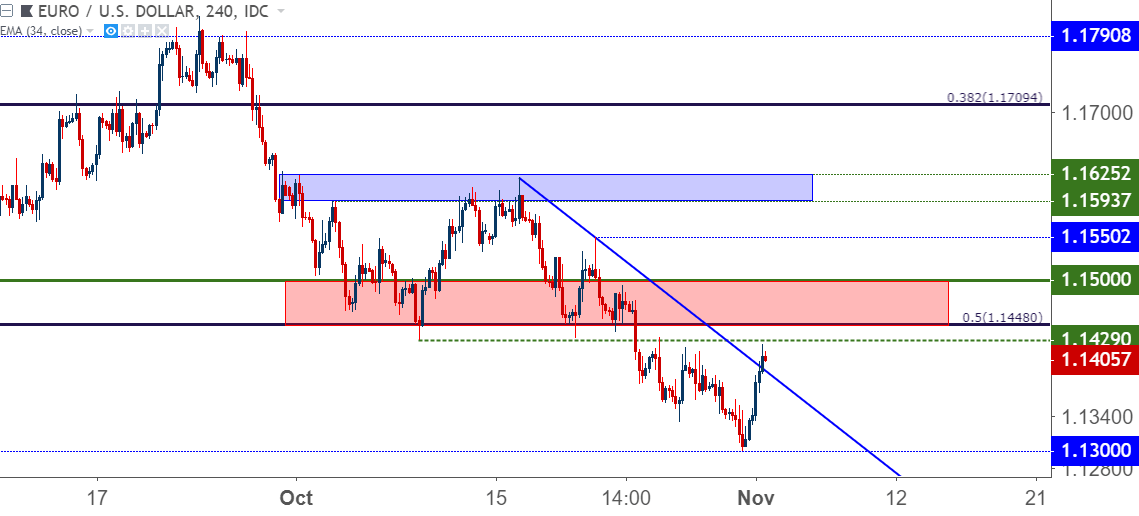
This pair retains some attractiveness on the short side for a couple of different reasons. The first and perhaps most important is price action and the fact that prices remain underneath that prior batch of support from 1.1448-1.1500. The second is that we still have yet to see resolution around the Italian budget. The next week brings a few items of interest on that front, and Italy is supposed to have a revised budget sent to Brussels by November 13th (the week after next), and at this point, there is no sign of either side backing down. Euro crisis fears could be back faster than markets might want, and this can keep the short-side of the Euro as attractive in the near-term, particularly should prices find resistance in that prior zone of support.
EUR/USD Four-Hour Price Chart
GBP/USD Rips Ahead of Super Thursday
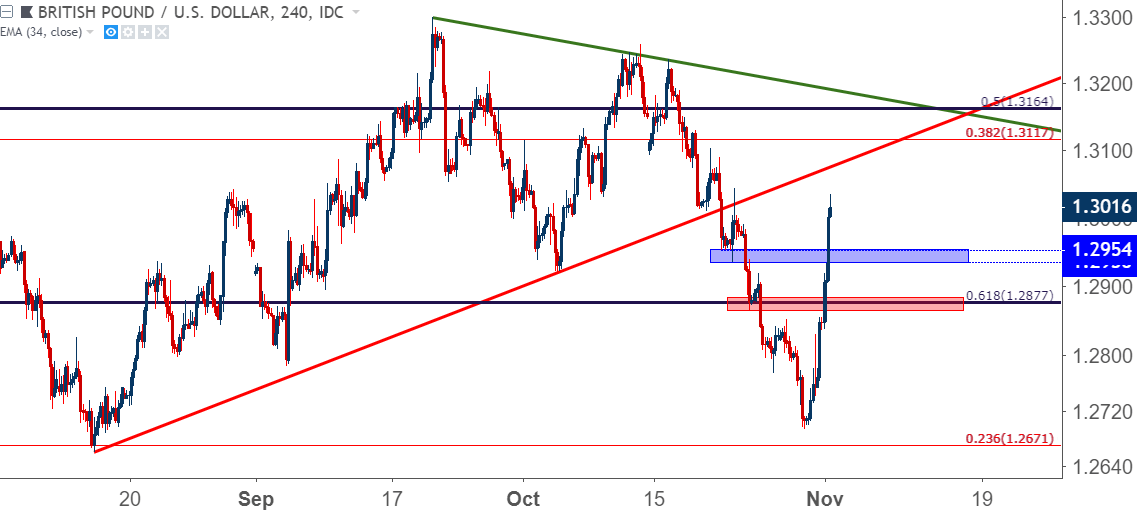
Some positivity has finally been seen on the Brexit front, and GBP/USD is in the midst of a major topside move today, shredding through both potential resistance areas that I was looking at in this week’s FX Setups. At this point, prices have started to re-test the 1.3000 handle, and this could be a dangerous spot to look for fresh GBP/USD exposure. On the long side of the pair, prices are stretched too far away from nearby swing points to justify adequate risk-reward. On the short side, today’s rip has been significant, and this may not be something that traders want to fade until they have some solid evidence of sellers responding. Until then, wait for a clearer backdrop.
GBP/USD Four-Hour Price Chart
USD/JPY Remains Cautiously Bullish
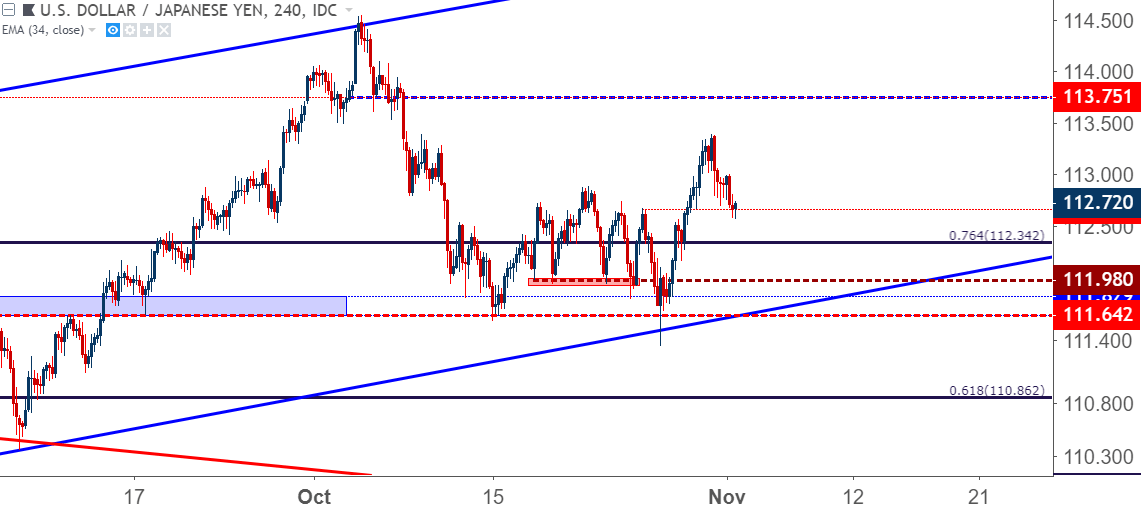
USD/JPY remains relatively messy. But I included this largely for reference, showing how a bit of Yen-strength has continued to play out after the earlier week build of bullish potential in the pair. While USD/JPY is not very clear, themes of Yen-volatility could potentially be sought out against the Euro in EUR/JPY or against the British Pound in GBP/JPY. I looked at the backdrop behind each pair a little later in the webinar.
USD/JPY Four-Hour Price Chart: Support at Prior Resistance
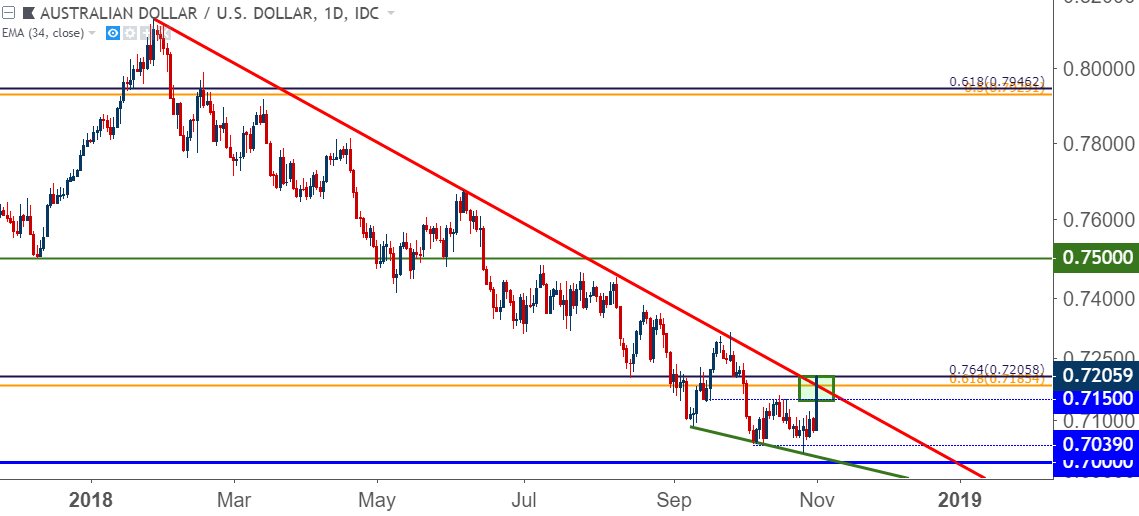
AUD/USD Jumps Past 2018 Bearish Trend-Line
This was my favored setup for USD-weakness this week, as the pair had spent much of the past two weeks with some element of support and respect of prior lows. Key here was the .7000 big figure, as buyers wouldn’t allow for a re-test, even with a backdrop of significant US Dollar strength. But – as USD-weakness began to show, the topside of AUD/USD really started to come into play. Prices have continued to rally through today’s session, finding a bit of resistance off of the confluent area around the .7200 big figure. This was previously strong support, and this could make bullish continuation strategies a bit difficult. But – higher-low support around prior resistance of .7150 could re-open the door for longs.
AUD/USD Daily Price Chart
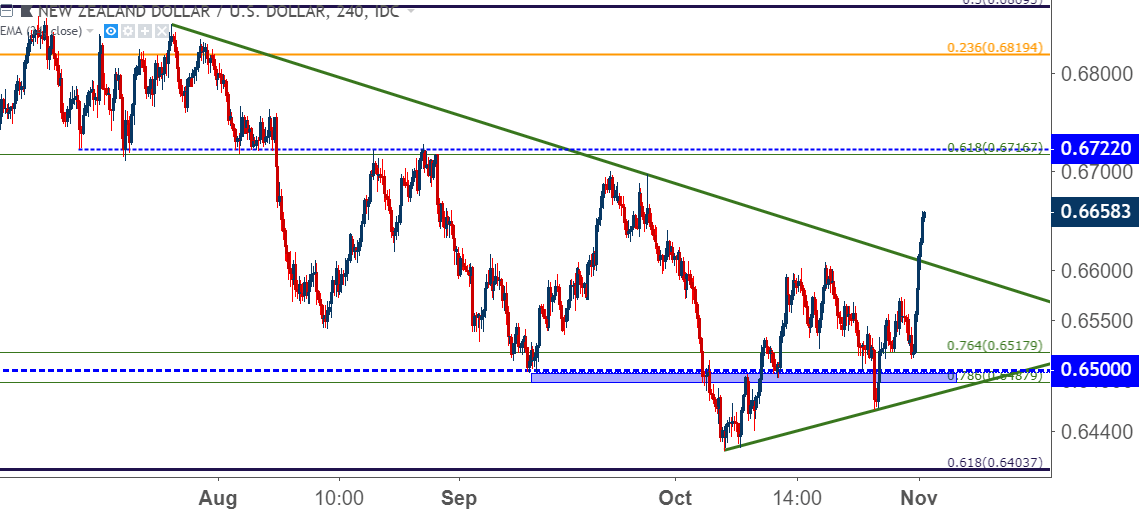
NZD/USD Breaks Out
Kiwi is putting in similar movement as AUD/USD, albeit to a lesser degree. This was my USD-weakness setup from the prior week, and this was furnished with a very similar backdrop. While USD-strength was running rampantly, NZD/USD continued to build from higher-low support. The topside of the pair came alive today, and prices are hard-charging to a big zone of resistance around .6725. At this point, a pullback to support at prior resistance around .6600 could keep the door open for bullish strategies.
NZD/USD Four-Hour Price Chart
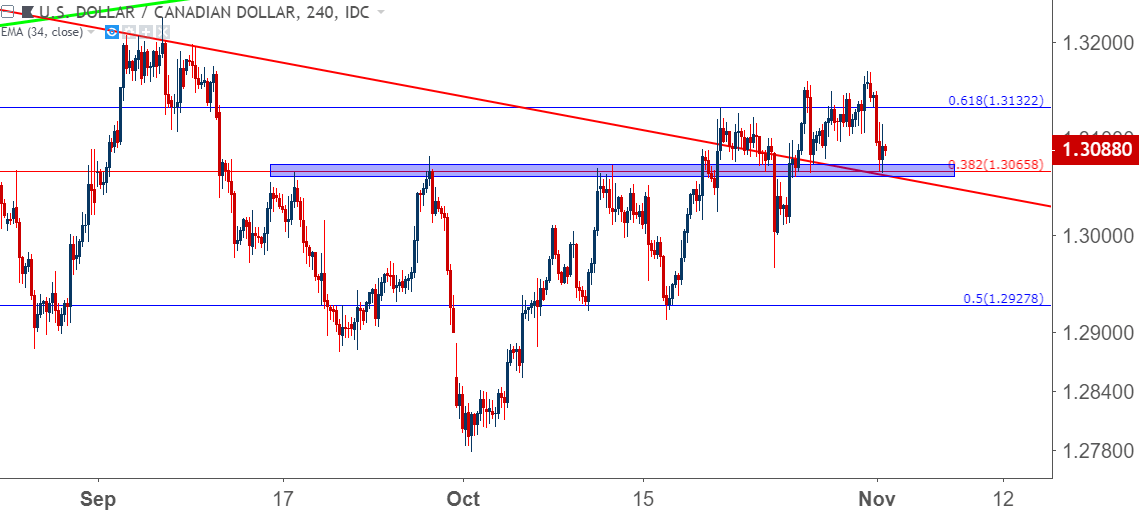
USD/CAD Tests Fibonacci Support
USD/CAD is sitting at a big level, and tomorrow morning brings a double-barreled item of risk to the fray as Canadian jobs numbers are released at the same time as NFP. The price of 1.3065 is the 38.2% Fibonacci retracement of the major move from the 2016 high down to the 2017 low, and this level has come into play a few different times over the past couple of months. This price helped to set resistance in September and October, followed by short-term support in the second-half of last month. Prices have fallen back to support here, again, and this could keep the door open for topside strategies in the pair.
USD/CAD Four-Hour Price Chart: Back to 1.3066
Caution with Equities and Return of the Risk Trade
So far, this week has seen some strength flow back into equities after what had become a brutal month of October. I published an article on the Dow yesterday, and that support area came into play around this morning’s open as prices pushed higher to further recover prior losses. Another item I’ve been talking about started to come into play as well, and that was a tweet from a particular account denoting calming relations on the tariff front. And that even helped to provide a small push off of support. But – at this point, the disconcerting item is that it hasn’t mattered more and that bulls haven’t shown a more decisive response. This could make bullish stances around stocks complicated, and I now want to see the Dow cross resistance around 25,500 before looking at additional topside exposure in the index.
Watch for Apple earnings set to be released after today’s bell.
Dow Jones Two-Hour Price Chart: Support Respected, but Bounce Enthusiastic
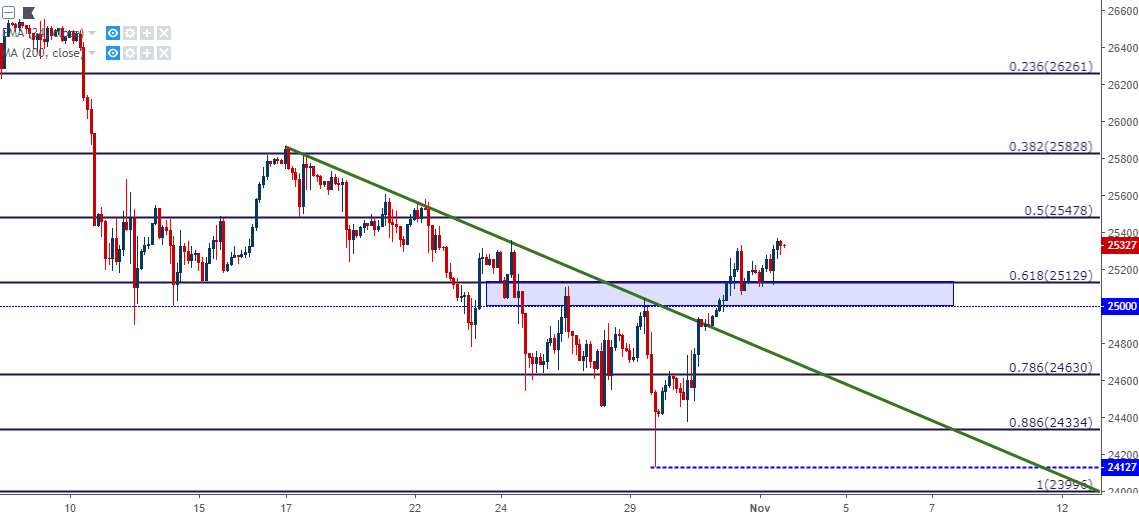
Chart prepared by James Stanley
To read more:
Are you looking for longer-term analysis on the U.S. Dollar? Our DailyFX Forecasts for Q4 have a section for each major currency, and we also offer a plethora of resources on USD-pairs such as EUR/USD, GBP/USD, USD/JPY, AUD/USD. Traders can also stay up with near-term positioning via our IG Client Sentiment Indicator.
Forex Trading Resources
DailyFX offers an abundance of tools, indicators and resources to help traders. For those looking for trading ideas, our IG Client Sentiment shows the positioning of retail traders with actual live trades and positions. Our trading guides bring our DailyFX Quarterly Forecasts and our Top Trading Opportunities; and our real-time news feed has intra-day interactions from the DailyFX team. And if you’re looking for real-time analysis, our DailyFX Webinars offer numerous sessions each week in which you can see how and why we’re looking at what we’re looking at.
If you’re looking for educational information, our New to FX guide is there to help new(er) traders while our Traits of Successful Traders research is built to help sharpen the skill set by focusing on risk and trade management.
--- Written by James Stanley, Strategist for DailyFX.com
Contact and follow James on Twitter: @JStanleyFX


