


US Dollar Talking Points:
- The US Dollar is pulling back to start a fresh month after what had become a very strong showing in October. The past two weeks were especially bullish for the Greenback, as both EUR/USD and GBP/USD put in aggressive downside runs that have, thus far, fallen short of testing the 2018 lows. The British Pound has put in some noticeable topside movement this morning as a bit of positivity on the Brexit front showed ahead of the BoE Super Thursday rate decision, and that rate meeting seemed to add a bit of strength into the mix.
- The recent run of USD strength has an uneven distribution across major pairs, as seen through pairs like NZD/USD and AUD/USD. While the Dollar was ripping over the past two weeks, each of those pairs retained some bullish qualities: NZD/USD respected prior October lows while AUD/USD held above the .7000 big figure. Now that some retracement has shown in the Dollar, each of those pairs have firmed up to fresh highs while an element of bearish behavior can still be detected in EUR/USD and, now to a lesser degree given this morning’s rip, GBP/USD.
- DailyFX Forecasts on a variety of currencies such as the US Dollar or the Euro are available from the DailyFX Trading Guides page. If you’re looking to improve your trading approach, check out Traits of Successful Traders. And if you’re looking for an introductory primer to the Forex market, check out our New to FX Guide.
Do you want to see how retail traders are currently trading the US Dollar? Check out our IG Client Sentiment Indicator.
US Dollar Pulls Back to Start November
A very active October across global markets has led into a busy November open. The calendar for the next few trading days could continue to drive this volatility across markets, as tomorrow brings Non-Farm Payrolls and next week brings mid-term elections in the US.
DailyFX Economic Calendar High-Impact Events for the Remainder of This Week

Chart prepared by James Stanley
The US Dollar opened November trade by beginning to pullback from the 97.00 level last night around the open of trade in Asia, and that pullback has continued through the Euro open. The selling appears to have slowed around a key level of 96.47, which is the 23.6% Fibonacci retracement of the 2011-2017 major move in DXY, and this is the same Fibonacci study that helped to mark the low in February of this year around 88.26.
US Dollar Daily Price Chart: Pullback to 23.6% Fibonacci Support (2011-2017 Major Move)

Chart prepared by James Stanley
This level had provided a bit of resistance on the way up, but that could only hold for about a day before buyers pushed prices up to test the 2018 high, which was set on Tuesday of this week. But, once prices traded above 97.00, buyers dried up and prices began to soften, and that theme continues into this morning. The big question is where buyers might show-up to offer higher-low support, and given the stretch run of the past two weeks, there are a few additional items of interest to work with here.
The level of 96.28 is interesting as this is the 38.2% retracement of the two-week bullish breakout in the Dollar, and this is confluent with a batch of prior swing-low support. A bit deeper, around the 50% marker of that two-week move is another level of interest around 96.00. This is confluent with the 96.04 level, which is the 50% marker of the 2017-2018 move in DXY, and this level had also helped to offer some resistance when prices were making their way higher earlier in October.
US Dollar Four-Hour Price Chart

Chart prepared by James Stanley
As I’ve been discussing in webinars, posture around the US Dollar remains a ‘pick your spots’ type of scenario, as that Dollar strength on the way up and the corresponding pullback this morning appear to be unevenly distributed across major pairs.
NZD/USD and AUD/USD are showing this Dollar pullback rather visibly, as each of those markets are in the process of making higher-highs, taking out a number of short-term resistance levels in the process.
NZD/USD Four-Hour Price Chart
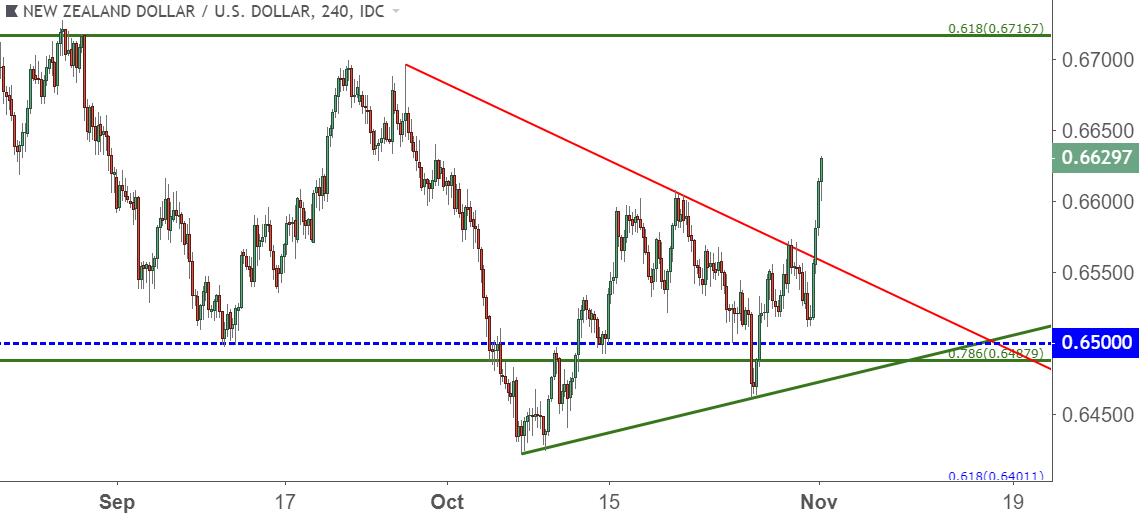
Chart prepared by James Stanley
I had looked at AUD/USD coming into this week, focusing on the hold of support above the .7000 big figure. The fact that this support held, and that the selling slowed even when the US Dollar was breaking out to fresh yearly highs made it an interesting candidate for USD-weakness. I had looked at this setup again in Tuesday’s webinar.
AUD/USD is now trading above a bearish trend-line that’s held the highs in the pair for almost the entirety of 2018 trade. We did have one intra-day test above in September, but that failed-out as sellers came back to push prices below ahead of that Daily close.
AUD/USD Daily Price Chart: Testing Above 2018 Bearish Trend-Line
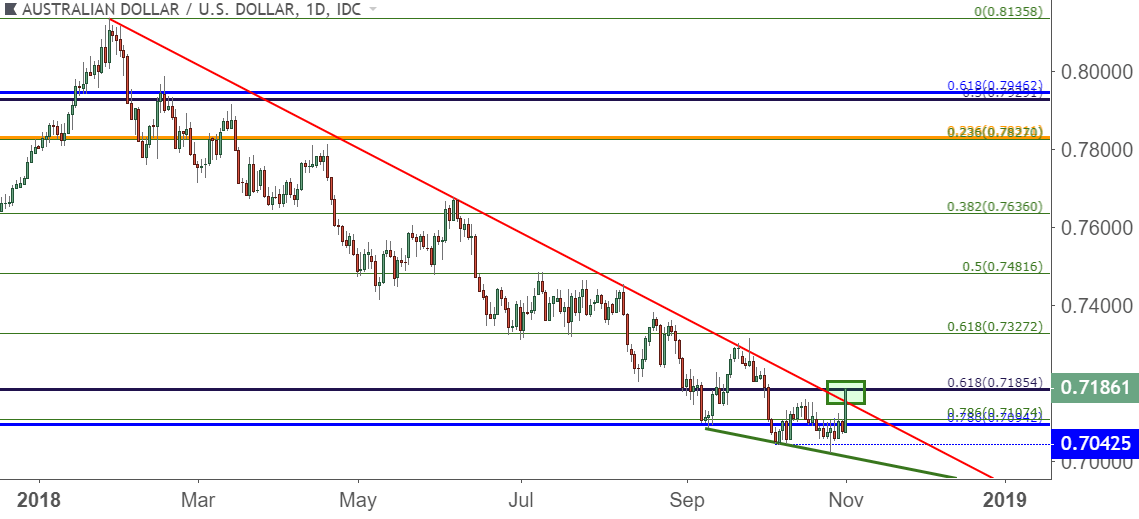
Chart prepared by James Stanley
EUR/USD Bears Fail at 2018 Low
While both AUD/USD and NZD/USD price action are working on fresh near-term highs, EUR/USD has yet to do the same, and is fast approaching the resistance zone I had looked at in this week’s FX Setups of the Week, and that runs from 1.1448-1.1500. This takes place after a failure at the 1.1300-handle, and this is the same level that provided a bounce to the pair in mid-August. Lower-high resistance potential around that zone of prior October support can keep the door open for short-side approaches, and that can remain interesting for strategies of USD-strength continuation after a pullback from fresh yearly highs.
EUR/USD Four-Hour Price Chart
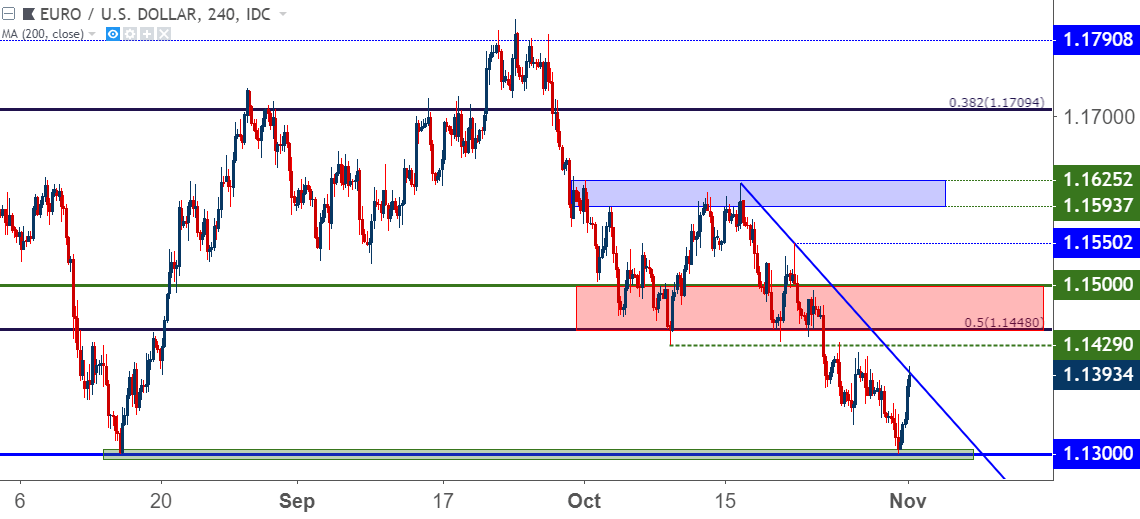
Chart prepared by James Stanley
GBP/USD Bounces After Failed Test of August Low
GBP/USD is putting in some stretch, and the bulk of this move showed-up ahead of this morning’s BoE rate decision. The rate meeting has seemed to add a bit of fuel to the fire though, and prices have jumped beyond the 1.2877 level that I was looking to for lower-high resistance. There’s a second zone that remains workable, and this was outlined in this week’s FX Setups from 1.2936-1.2954.
Given the veracity of the move, traders may want to treat this theme with extreme caution, as we may be in the midst of a bigger picture change. GBP/USD has been beset by Brexit worries since late-September, and we may finally be seeing some of that clear out of the way as positive headlines over the past couple of days have brought buyers back into the mix. If no resistance develops around 1.2936-1.2954, the next level of interest is the 1.3000 psychological level, and a re-claim of that may eventually re-open the door to bullish strategies. Until then, bearish strategies should be treated with caution.
GBP/USD Four-Hour Price Chart
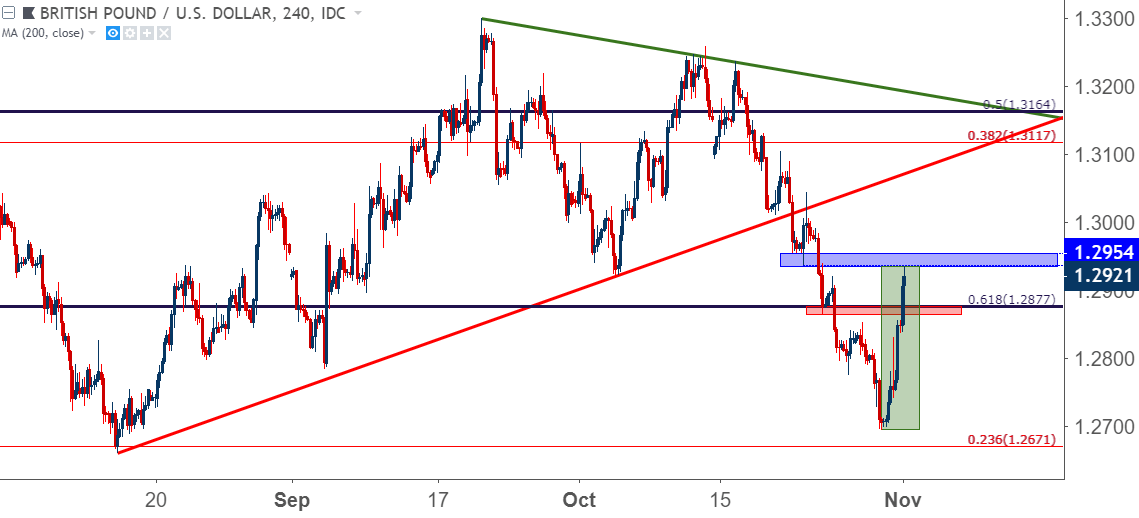
Chart prepared by James Stanley
To read more:
Are you looking for longer-term analysis on the U.S. Dollar? Our DailyFX Forecasts for Q4 have a section for each major currency, and we also offer a plethora of resources on USD-pairs such as EUR/USD, GBP/USD, USD/JPY, AUD/USD. Traders can also stay up with near-term positioning via our IG Client Sentiment Indicator.
Forex Trading Resources
DailyFX offers a plethora of tools, indicators and resources to help traders. For those looking for trading ideas, our IG Client Sentiment shows the positioning of retail traders with actual live trades and positions. Our trading guides bring our DailyFX Quarterly Forecasts and our Top Trading Opportunities; and our real-time news feed has intra-day interactions from the DailyFX team. And if you’re looking for real-time analysis, our DailyFX Webinars offer numerous sessions each week in which you can see how and why we’re looking at what we’re looking at.
If you’re looking for educational information, our New to FX guide is there to help new(er) traders while our Traits of Successful Traders research is built to help sharpen the skill set by focusing on risk and trade management.
--- Written by James Stanley, Strategist for DailyFX.com
Contact and follow James on Twitter: @JStanleyFX


