


US Dollar Talking Points:
- The US Dollar has finally found some element of short-term resistance after the bullish breakout has driven price action throughout August. Resistance appears to be coming-in from the 23.6% Fibonacci retracement of the 2011-2017 major move, and this was the first target for the US Dollar in our Q3 Technical Forecast for the currency. An additional topside target remains from that forecast, and with half of the quarter remaining, that remains a feasible expectation.
- The remainder of this week’s economic calendar is extremely light of US items, with only retail sales (tomorrow) followed by University of Michigan Consumer Sentiment (Friday). The more pressing US Dollar driver may be something that’s not directly related to the US at all, as UK inflation is sitting on the docket for tomorrow morning. This data point had helped the Dollar to form support in mid-April, just ahead of the topside breakout that remains in play almost four months later.
- DailyFX Forecasts on a variety of currencies such as the US Dollar or the Euro are available from the DailyFX Trading Guides page. If you’re looking to improve your trading approach, check out Traits of Successful Traders. And if you’re looking for an introductory primer to the Forex market, check out our New to FX Guide.
Do you want to see how retail traders are currently trading the US Dollar? Check out our IG Client Sentiment Indicator.
US Dollar’s Bullish Breakout Runs into Fibonacci Resistance
The US Dollar is continuing to hold on to gains from the prior two weeks. The Greenback began to resolve its digestion as we wound down the month of July, with prices catching a bit of support on a bullish trend-line as we closed out the month. But, that bullish trend-line was part of an ascending triangle formation, and after prices caught a bit of resistance at the yearly highs during the first week of the month, bulls brought a strong topside breakout last week to drive the Dollar to fresh yearly highs.
That enthusiasm has largely continued as we trade into a new week. Dollar bulls continued to push after the Sunday open, and prices soon ran into a key area of resistance at 96.47. This was the first target for our US Dollar Technical Forecast for Q3, and this comes from the 23.6% Fibonacci retracement of the 2011-2017 major move. This is also the same retracement study that helped to mark the Greenback’s low in the month of February when support built-in off the 50% marker.
Click Here For Full Access to the DailyFX Q3 Trading Forecasts
US Dollar Weekly Price Chart: Resistance at 23.6 After 50% Support in February

Chart prepared by James Stanley
Since first running into resistance on Sunday night, bulls have remained persistent, but as of yet, haven’t been able to break through this level. This opens the door for pullback potential, and there’s another area of interest just below current price action around the whole number of 96.00. A bit below that we have the prior area of resistance that had held the highs in USD for a month-and-a-half, and this becomes the next operative area of potential support should the Dollar fall back-below 96.00.
US Dollar via ‘DXY’ Four-Hour Price Chart: Support Potential for Bullish Continuation
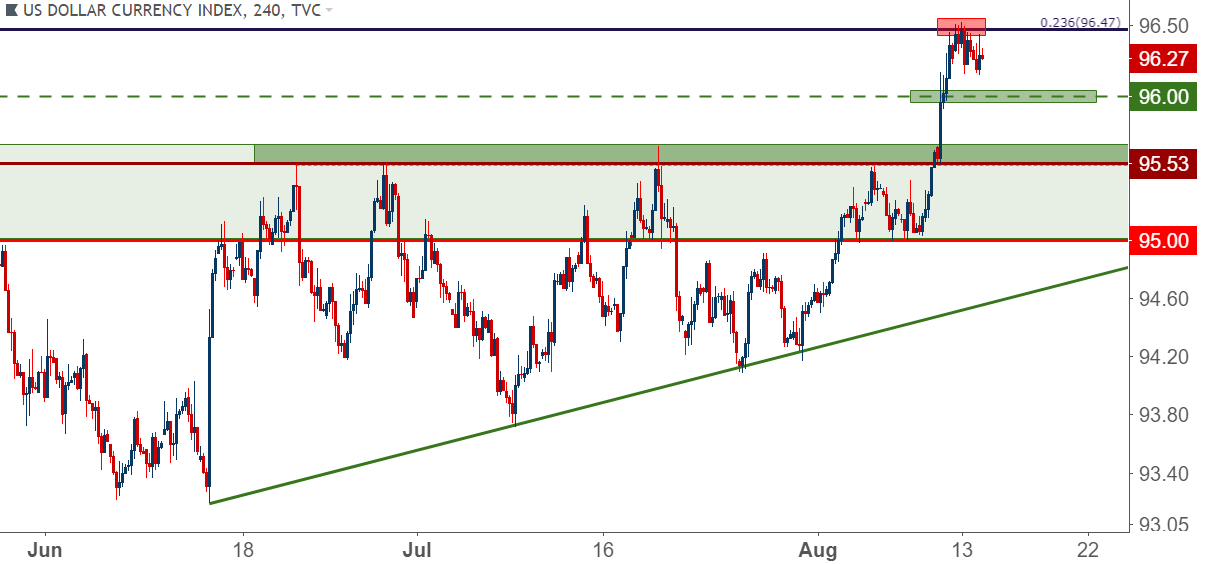
Chart prepared by James Stanley
The Economic Calendar
On the driver side for the US Dollar, there isn’t much to work with on this week’s economic calendar, with the sole high-impact US items to be released on Wednesday with retail sales figures and on Friday with U of Michigan Consumer Sentiment.
More interesting to this theme is an item that’s not directly-related to the United States – but it’s also something that had helped that US Dollar breakout to get underway in April. We’re referring to UK inflation figures, and in mid-April when this print came out in a disappointing manner, GBP/USD started to turn-lower and this brought upon a strong bid in the US Dollar. Just a week later we had the dovish ECB rate decision, and the US Dollar was off to the races. But – that fire of US Dollar strength appeared to start around the release of UK inflation numbers for the month of March (taking place in mid-April), and given that we have another of these on the calendar – we can combine that with the currently beleaguered backdrop in the British Pound and there is the potential for some US Dollar movement off of this UK inflation print.
DailyFX Economic Calendar – High-Impact Items Remaining for This Week (Times in ET)
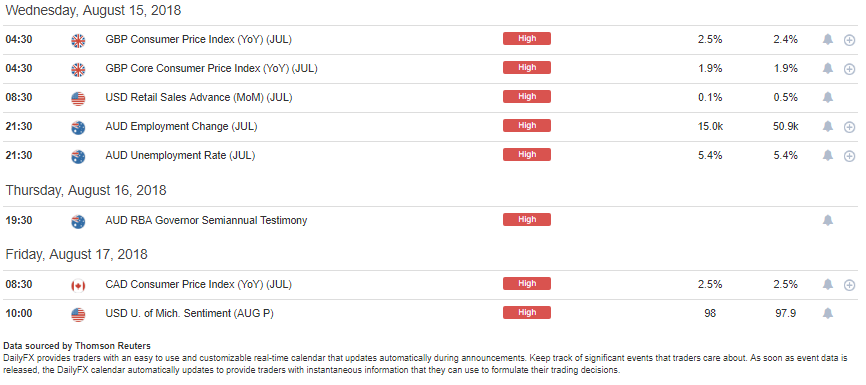
Chart prepared by James Stanley
British Pound Remains Weak and Oversold Ahead of UK Inflation
It’s been another brutal month for the British Pound, extending a rough four-month patch in the currency as inflation has continued to soften in the economy. After watching inflation run above 3% for five consecutive months to close 2017 and open 2018, the Bank of England warned of potential rate hikes at their ‘Super Thursday’ rate decision in February. Given that the bank has been reticent to make moves at non-Super Thursday rate decisions, this circled the meeting in May as the next probable area for a rate hike.
But before we got to that rate decision, inflation started to turn-lower in mid-April, and the BoE backed away from tighter policy at that meeting and GBP/USD dug into support around 1.3500. After that we had another flare of Brexit risk and this sent the Pound even-lower. A flicker of strength began to show in mid-July as rumors began to circulate that the BoE may be more-hawkish than expected, largely on the basis of still-elevated inflation figures. Markets were fully expecting a 25 basis point rate hike, but there remained a great deal of uncertainty around what happens after.
The Bank of England took a very dovish outlook to markets at the August rate decision, and despite the fact that the bank hiked rates for only the second time in the past decade, the British Pound started to fall, and didn’t really stop until we came into this week. Yesterday produced a Doji on the Daily Chart, and so far this morning that support appears to be holding.
GBP/USD Weekly Price Chart: Oversold RSI For First Time Since post-Flash Crash (Oct, 2016)
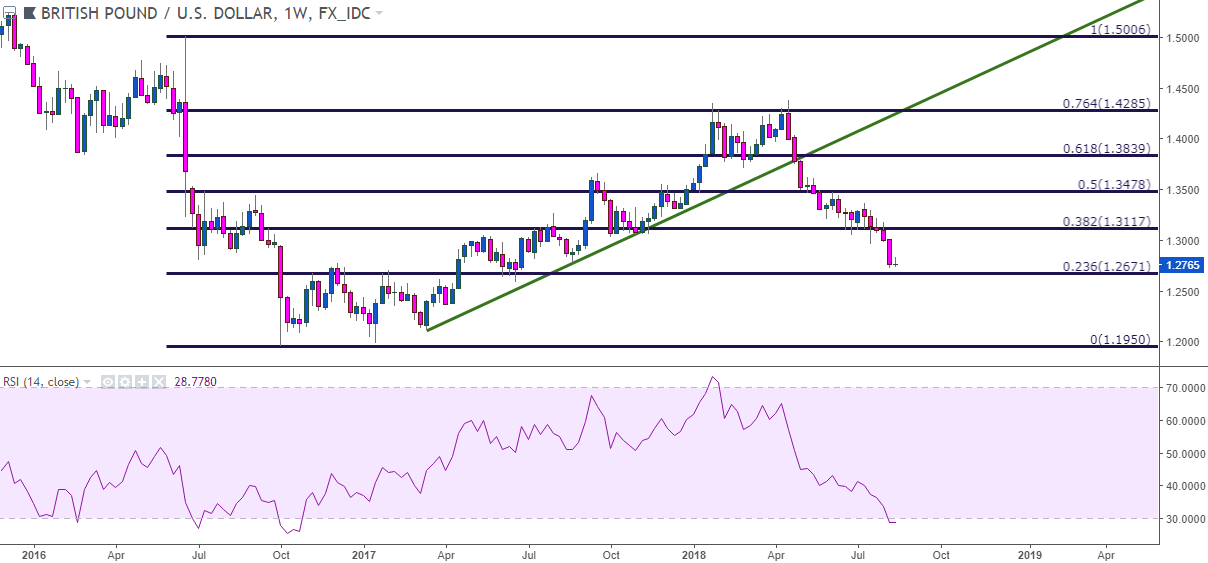
Chart prepared by James Stanley
We discussed this theme at greater length in yesterday’s technical article on GBP/USD entitled, GBP/USD: Cable Attempts to Carve Out Support, But Can it Hold?
In the article we looked at the oversold nature of the setup at the moment, and urged caution towards chasing the move-lower while prices were holding support at yearly lows. This doesn’t necessarily obviate the bearish stance, however, as a blip of strength in the pair around tomorrow’s inflation release can bring prices to a more attractive area of resistance, at which point bearish continuation strategies can come into focus again.
Below, we look at two potential areas of resistance below the 1.3000 psychological level in GBP/USD, the first of which has already come into play with a 50+ pip resistance reaction earlier this morning. If prices don’t print down to fresh lows after that first area of resistance, then the door is open for a move up to the second area of resistance that runs from 1.2918-1.2956.
GBP/USD Hourly Price Chart: Lower-High Resistance Potential for Bearish Continuation
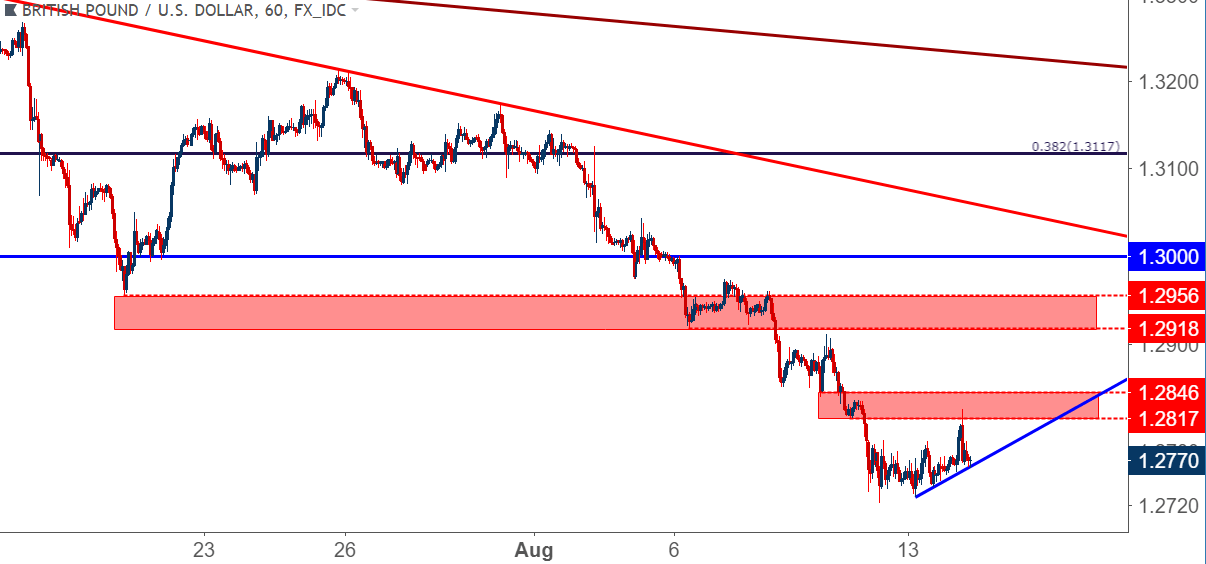
Chart prepared by James Stanley
Euro Bears Keep the Pressure On
Last week saw another wave of weakness in the single currency as fears around contagion continued to grow. The big point of concern appears to be Spanish banks, who are carrying €80 Billion-plus of exposure to Turkish banks. And given the tight trading relationships within the Euro Zone and particularly European banks, who have been beset by low-to-negative rate regimes over the past five years, there appears to be vulnerability shared throughout the European banking sector.
EUR/USD Daily Price Chart: Breakdown to Fresh Yearly Lows Last Week

Chart prepared by James Stanley
This concern pushed EUR/USD down to fresh lows last week and the selling remained intense into the close. This week, prices gapped-down but have since been trading back-and-forth as support has dug-in around the 1.1365 area on the chart. Bears have remained active, continuing to sell off of short-term resistance around the 1.1425 level.
EUR/USD Hourly Price Chart: Short-Term Range Builds Near Fresh Yearly Lows

Chart prepared by James Stanley
We looked into the pair as part of our FX Setups for this week, looking for the pair to work up to lower-high resistance which can open the door for bearish continuation strategies. Those potential resistance areas have yet to come into play, and this remains a workable theme as we trade deeper into this week.
EUR/USD Four-Hour Price Chart
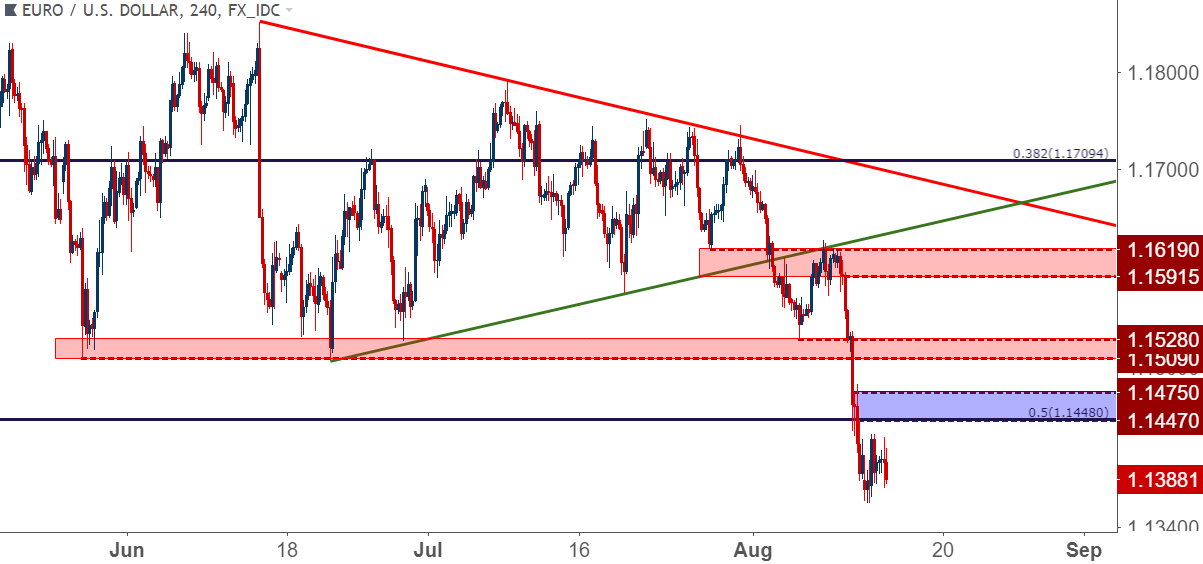
Chart prepared by James Stanley
To read more:
Are you looking for longer-term analysis on the U.S. Dollar? Our DailyFX Forecasts for Q3 have a section for each major currency, and we also offer a plethora of resources on USD-pairs such as EUR/USD, GBP/USD, USD/JPY, AUD/USD. Traders can also stay up with near-term positioning via our IG Client Sentiment Indicator.
Forex Trading Resources
DailyFX offers a plethora of tools, indicators and resources to help traders. For those looking for trading ideas, our IG Client Sentiment shows the positioning of retail traders with actual live trades and positions. Our trading guides bring our DailyFX Quarterly Forecasts and our Top Trading Opportunities; and our real-time news feed has intra-day interactions from the DailyFX team. And if you’re looking for real-time analysis, our DailyFX Webinars offer numerous sessions each week in which you can see how and why we’re looking at what we’re looking at.
If you’re looking for educational information, our New to FX guide is there to help new(er) traders while our Traits of Successful Traders research is built to help sharpen the skill set by focusing on risk and trade management.
--- Written by James Stanley, Strategist for DailyFX.com
Contact and follow James on Twitter: @JStanleyFX


