


Talking Points:
- Yesterday’s FOMC rate decision brought little by way of new information, but the bank did sound positive on the prospect of continued strength in the US economy. The follow-thru impact of yesterday’s rate decision has seen an extension of USD-strength in the Asian and European sessions, and this is coupled with a pullback in US stocks.
- This morning brought a rate hike from the Bank of England for only the second time since the Global Financial Crisis, but the context with which this hike was implemented brings a number of questions to direction of both the UK economy and the British Pound. The net response from that BoE rate hike thus far has been a bearish move in the British Pound, with GBP/USD making a fast approach towards the 1.3000 psychological level.
- DailyFX Forecasts on a variety of currencies such as the US Dollar or the Euro are available from the DailyFX Trading Guides page. If you’re looking to improve your trading approach, check out Traits of Successful Traders. And if you’re looking for an introductory primer to the Forex market, check out our New to FX Guide.
Do you want to see how retail traders are currently trading the US Dollar? Check out our IG Client Sentiment Indicator.
No Change FOMC Leads into BoE Rate Hike
It’s been an interesting 24 hours across global markets, as yesterday’s FOMC rate decision led into this morning’s BoE ‘Super Thursday.’ While the Fed made no alterations to policy in yesterday’s statement, the bank did make a special effort to note the strength that’s currently being seen in the US economy. The Bank of England, on the other hand, did hike rates at this morning’s meeting, but they did so while sounding not too positive on the outlook for the UK economy. This morning’s hike was brought upon with a 9-0 vote at the Bank of England, and they also warned that future rate hikes will likely be needed. But – the bank is looking at one more hike going out to 2020, and Mark Carney noted the disinflationary impact of Brexit, heavily implying that the Bank of England could cut rates in a ‘hard Brexit’ scenario. This brings on a puzzling array of how the MPC could be a) unanimous in voting for a rate hike today b) confident that the economy will need future rate hikes while c) being so uncertain about economic direction of the UK given the upcoming EU-UK negotiations over Brexit, to the point where the bank might need rate cuts.
The net result in British Pound price action has been weakness, as the currency initially firmed-up to the Fibonacci level at 1.3117, before starting to fall as Mark Carney began his accompanying press conference, and continuing to drop throughout his speech. Prices are now hard-charging for the 1.3000 psychological level, and this begs the question as to whether or not this morning’s outlay might be enough to push the pair through this vaulted level.
GBP/USD One-Minute Chart Around BoE: Initial Strength on Hike Quickly Faded-Out
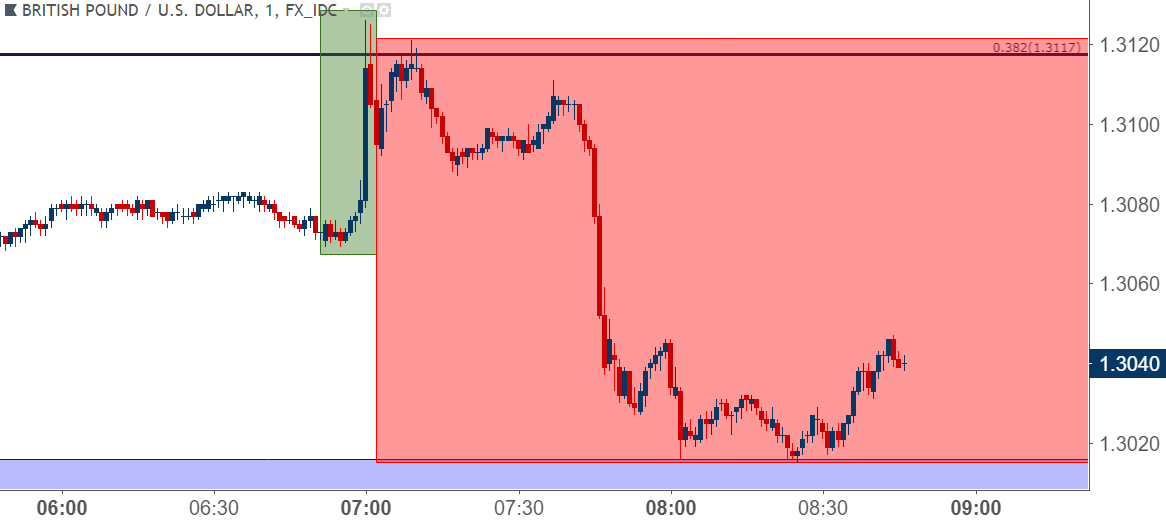
Chart prepared by James Stanley
Tomorrow’s economic calendar brings Non-Farm Payrolls out of the United States, and if we are going to see a sustained break through 1.3000 in GBP/USD, then we’re likely going to need some help from the US Dollar, which is now beginning to test a resistance zone that’s been relevant for the past two months.
GBP/USD Daily Price Chart: The 1.3000 Level Looms Ominously After the July Bounce

Chart prepared by James Stanley
US Dollar Extends Support Bounce – Now Testing 95.00 Resistance on DXY
Yesterday’s FOMC rate decision had a theme, and that theme was the word ‘strength,’ as this was mentioned multilpe times in the Fed’s statement which brought no changes to rate policy. This did, however, firm odds for rate hikes in September and again in December as it appears that the bank is set for another two rate rises in the calendar year of 2018, and given the fact that the Fed is pretty much the only major Central Bank looking at tighter policy in the month ahead, this can keep the US Dollar in focus for themes of strength.
Following yesterday’s meeting, Dollar strength continued to show through the Asian and European sessions. At this point, DXY is testing the 95.00 level, which has been acting as resistance since prices first re-engaged in late May. Both June and July brought deeper topside tests above this area but, to date, each has failed and prices reverted back to support.
US Dollar via ‘DXY’ Four-Hour Price Chart: Support Bounce Extends to Test 95.00 Resistance

Chart prepared by James Stanley
Tomorrow’s NFP report can be a driver behind this theme, and the expectation for tomorrow’s print is for 193k jobs to have been added to American payrolls in July. This is coupled with an expected unemployment rate of 3.9% and Average Hourly Earnings growth at an annualized 2.7%.
As we’ve seen in the recent past, the Average Hourly Earnings portion of the report will likely receive considerable attention provided that the headline number doesn’t print too far away from the expectation. Inflation, and specifically inflation in wages is something the Fed has been watching while monitoring economic performance through this current rising rate cycle. If we do see strength in wages, combined with a headline number that doesn’t disappoint, we’ll likely see the Dollar continue testing above 95.00 as we near next week’s US inflation data. Next week’s inflation for the month of July is expected to come in at 3%, continuing to echo strength in the US economy that keeps the door open for the Fed’s rate hike plans in 2019.
US Dollar via ‘DXY’ Daily Price Chart
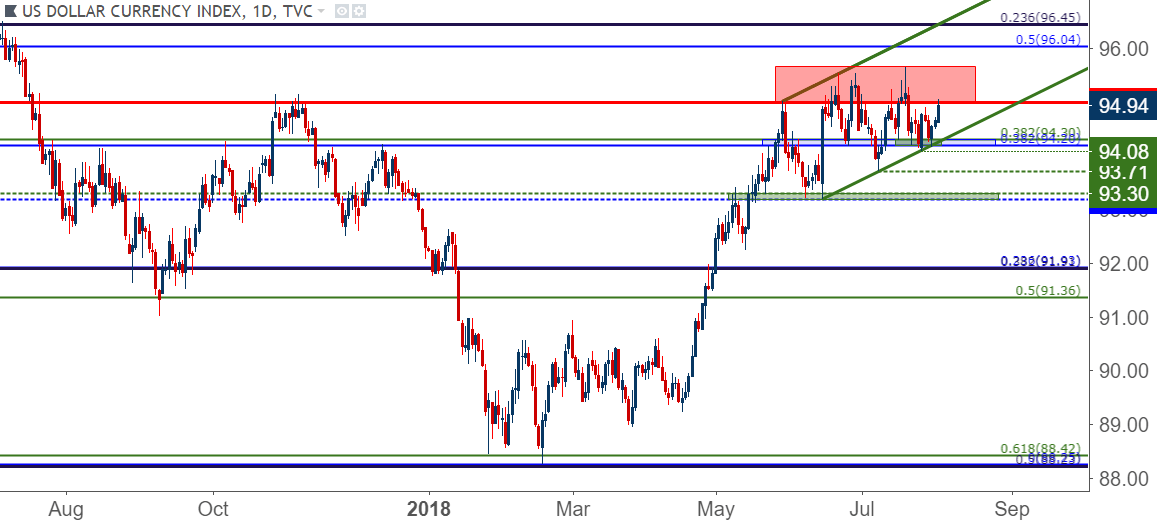
Chart prepared by James Stanley
Be Careful in the Euro, EUR/USD Fresh Two-Week Lows Finds Trend-Line Support
Going along with that Dollar strength was a move-lower in EUR/USD, but traders looking for a break out of the recent digestion would likely want to treat this move with caution, as we’re still seeing some support hold from a trend-line taken from the June 21st and July 19th swing lows. With a really big driver sitting on the docket for tomorrow, chasing the move lower could be a challenge at this point. The bigger question, and perhaps more pertinent to trend traders is what the pair does upon a re-test of the 1.1509 low that was tested twice last quarter, first in late-May and then again after the ECB’s June interest rate decision.
EUR/USD Four-Hour Price Chart: Fresh Two-Week Lows Find Trend-Line Support
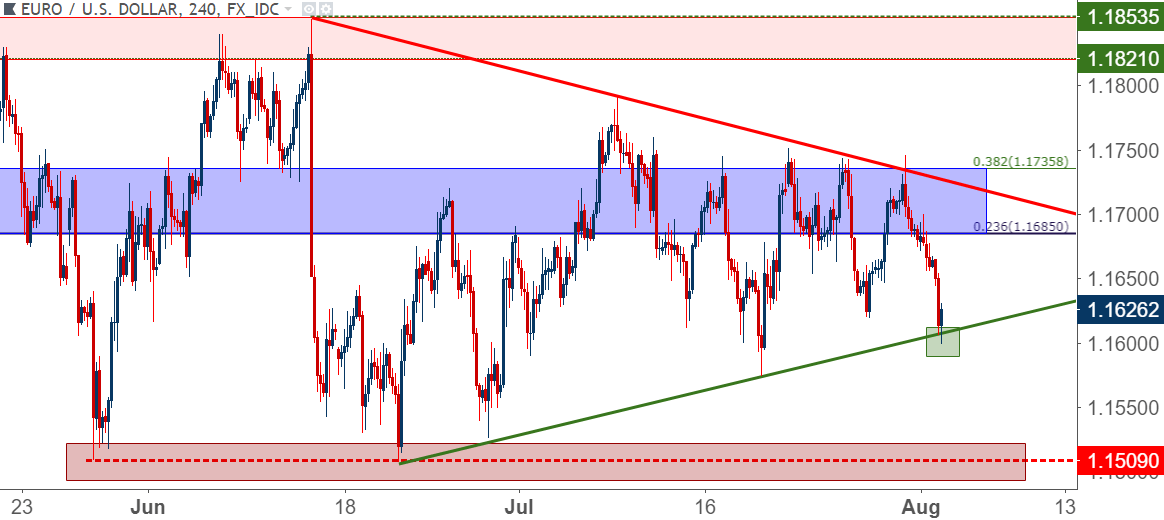
Chart prepared by James Stanley
Stocks Drop After FOMC
As USD strength has shown up after yesterday’s FOMC rate decision, so has weakness in US stocks. Earlier this week we looked into the Dow Jones after what became a very strong month of July. Prices had started to show signs of pulling back, as indicated by lower-lows and lower-highs, and we looked at the prospect of playing pullbacks to support.
Prices are testing the support zone in the Dow that we’d looked at that runs around the 25,200 area, and this is also showing support from a prior trend-line projection that had previously helped to provide resistance. If this doesn’t hold up, it appears as though the next stop would be around the 25,000 psychological level, and if we do break-below the swing at 24,887, bearish strategies may begin to become attractive again.
Dow Jones Four-Hour Price Chart
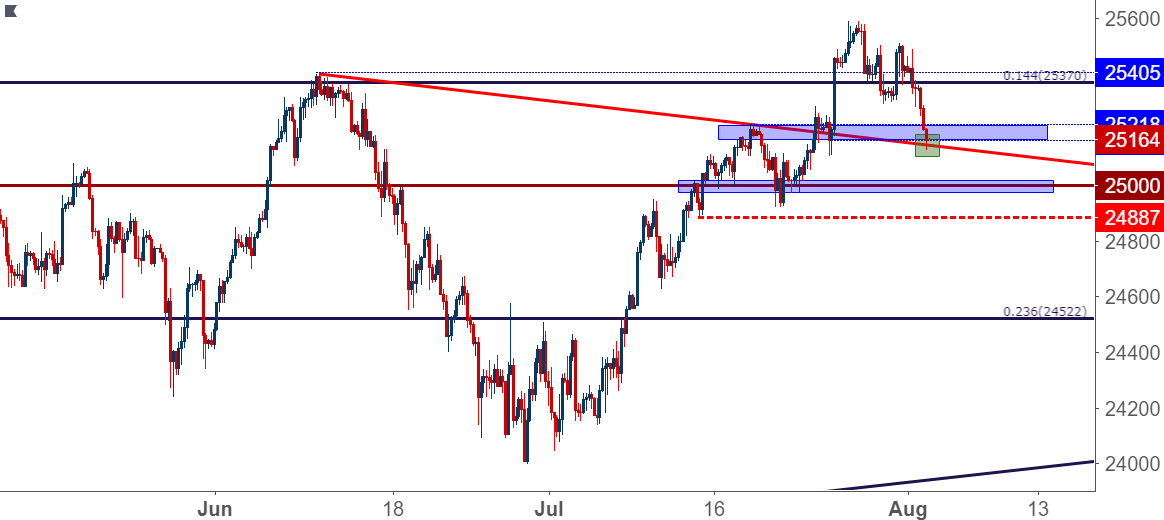
Chart prepared by James Stanley
To read more:
Are you looking for longer-term analysis on the U.S. Dollar? Our DailyFX Forecasts for Q1 have a section for each major currency, and we also offer a plethora of resources on USD-pairs such as EUR/USD, GBP/USD, USD/JPY, AUD/USD. Traders can also stay up with near-term positioning via our IG Client Sentiment Indicator.
Forex Trading Resources
DailyFX offers a plethora of tools, indicators and resources to help traders. For those looking for trading ideas, our IG Client Sentiment shows the positioning of retail traders with actual live trades and positions. Our trading guides bring our DailyFX Quarterly Forecasts and our Top Trading Opportunities; and our real-time news feed has intra-day interactions from the DailyFX team. And if you’re looking for real-time analysis, our DailyFX Webinars offer numerous sessions each week in which you can see how and why we’re looking at what we’re looking at.
If you’re looking for educational information, our New to FX guide is there to help new(er) traders while our Traits of Successful Traders research is built to help sharpen the skill set by focusing on risk and trade management.
--- Written by James Stanley, Strategist for DailyFX.com
Contact and follow James on Twitter: @JStanleyFX


