


Talking Points:
- Today marks the end of Q1, 2018 and with many markets already closed in observance of Passover/Good Friday, the page has turned into Q2. The first quarter of this year was marked by a rise in equity volatility to go along with a fast jump in US Treasury Yields. FX markets were not left untouched, as a series of interesting themes has developed. We look into three of the more prominent below.
- The US Dollar remains extremely weak despite the fact that the Fed is one of the only games in town for rate hikes. This is likely emanating from concerns around fiscal policy, but it’s come along with moves of strengths in various stages of development in both the Euro and the Japanese Yen.
- Are you looking to improve your trading approach? Check out Traits of Successful Traders. And if you’re looking for an introductory primer to the Forex market, check out our New to FX Guide.
To receive James Stanley’s Analysis directly via email, please sign up here.
Open of Q2 Highlights a Number of Interesting Forex Themes
As we turn the page into the second quarter of 2018, a number of interesting themes remain across global financial markets. The first quarter of this year turned out to be quite eventful. We got the rate hike out of the Federal Reserve in March and the Fed is now forecasting an additional two moves in the year. We saw the Bank of England prep markets for a possible rate hike in May, and even the European Central Bank started to shift their language for what could lead to an eventual tightening of policy. This is the move that many have been waiting for (or fearing?) since the QE-heavy environment took over after the Financial Collapse, and this is when we see global Central Banks shift away from Quantitative Easing and uber-dovish monetary policy towards a more balanced stance and, in some cases, even Quantitative Tightening.
Below, we’re looking at three of the more interesting FX-related themes as we walk into Q2 of 2018, focusing-in on three of the world’s largest open economies and what may come about as we move deeper into the year. We discussed this topic in yesterday’s webinar, and if you’d prefer video or would just like a video accompaniment, that archive is available from the following link: Q2 Preview: USD Weakness, Yen Strength, Equity Vol in the Spotlight.
The US Dollar’s Persistent Weakness Continues
All in all, it wasn’t that bad of a quarter for the US Dollar. As we opened into the New Year this certainly didn’t seem as though it would be the case, as sellers continued to push the Greenback lower for the first few weeks of the year. But – a longer-term level of support came into play in January, and after another test in February prices continued to meander back-and-forth, building into the range that we were looking for in our Q1 technical forecast on the US Dollar.
US Dollar via ‘DXY’ Weekly Chart: Fibonacci Support in January, February Holds the Lows

Chart prepared by James Stanley
That longer-term area of support remains underneath price action, and this is taken from the 61.8% Fibonacci retracement of the 2014-2017 major move. The 50% retracement from that same study had helped us to carve out last year’s low in September, and that support inflection led to two months of strength. The support test at the 61.8 hasn’t led to as bullish of a response, and bears have remained fairly active here, continuing to come in to offer resistance below the 2017 low of 91.01 on DXY.
US Dollar via ‘DXY’ Daily Chart: A Less Enthusiastic Response to Fibonacci Support
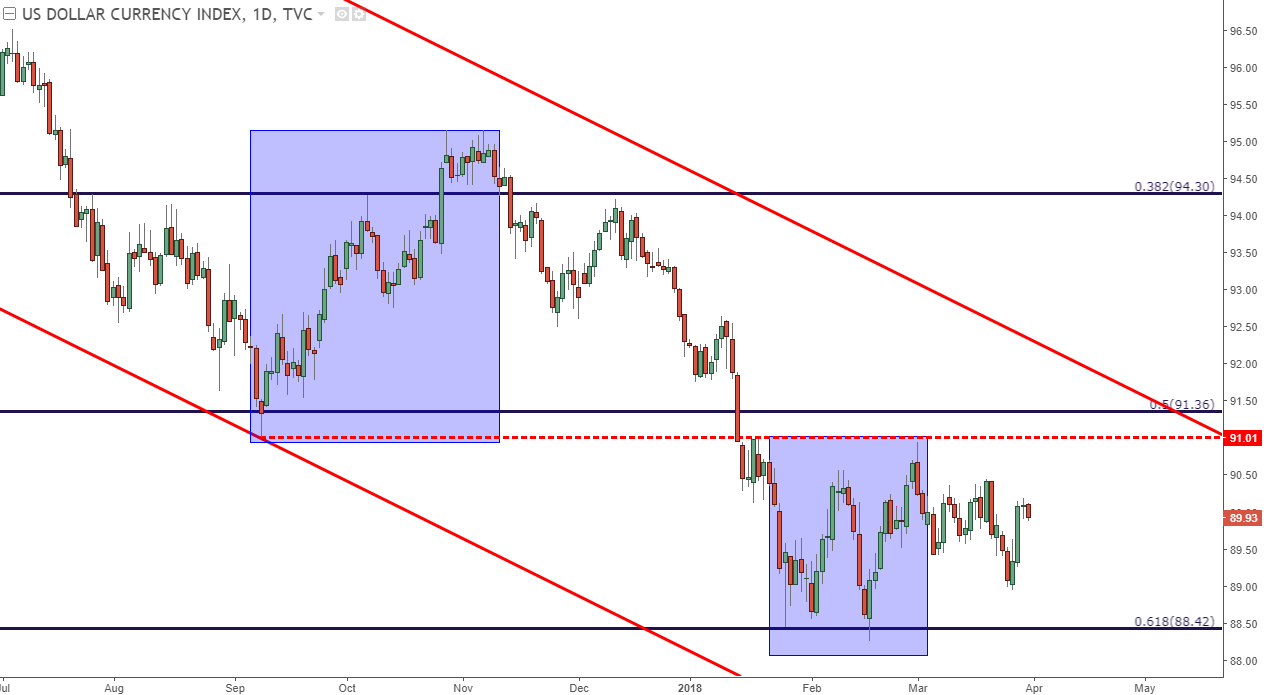
Chart prepared by James Stanley
Making this price action a bit more interesting is the backdrop. The Federal Reserve is one of the few large Central Banks actually looking at higher rates and tighter policy. This runs in stark contrast to many economies that are still at ‘pedal to the floor’ levels of accommodation, like Europe or Japan. And generally speaking, higher rates and tighter policy will bring strength into a currency as investors look to capture the new, higher rate of return.
Not only has that not been happening in the US Dollar, but we’ve basically been witnessing the opposite of that; begging the question of ‘why’?
US Fiscal Policy
There’s been quite a bit of change in Washington, D.C. of recent. And President Trump just signed a rather large budget for this year, bringing further focus onto the issue; and that’s fiscal expansion in the United States. The US government is bringing on half a trillion in extra spending over the next couple of years along with another trillion in tax cuts. Given that the US Government operates at a deficit, these initiatives will be funded by debt. To issue debt, and to raise funds, the US Treasury department increases the supply of available Treasuries; and like any other market, more supply with the same level of demand means lower prices. Lower prices and less demand for Treasuries means less demand for the US Dollar as investors look elsewhere for other attractive investment options, and it just so happens that there are bond markets still being supported by the representative Central Bank throughout Europe.
This also raises a series of questions around the vital market place in US Treasuries. With a US government that’s going to be furnishing more and more supply while also hiking rates, why would a bond investor hold on for what looks to be a tumultuous ride?
10-Year Treasury Yields Since 1994: January Jump Extends into February Before Resistance Comes Into Play
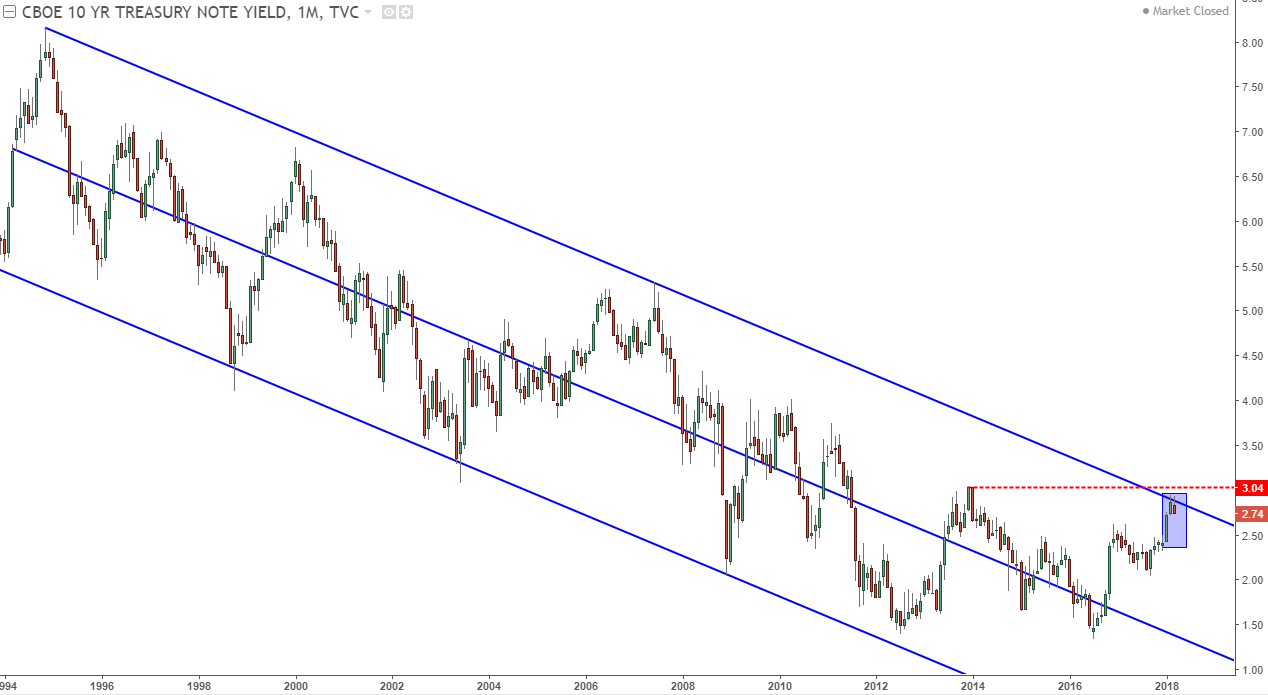
Chart prepared by James Stanley
Higher rates are a negative for bond prices as rates going higher means prices moving lower. We already know that the Fed wants to continue to hike in order to further normalize policy. We also know that the US government will probably be auctioning off a lot more debt to fund these new spending initiatives; and if we combine that with the fact that the Federal Reserve is well into their plans for Quantitative Tightening –this spells a very negative environment for bond traders, investors and funds.
In early-February, famed trader and hedge fund manager, Paul Tudor Jones made the comment of ‘If I had a choice between holding a US Treasury bond or a hot burning coal in my hand, I would choose the coal.’ The above reasons are the likely ‘why’, and this spells a troubling backdrop for US Treasury prices and, in-turn the US Dollar as we move deeper into 2018.
Yen Strength Begins to Show as Japanese Inflation Runs Higher
Another interesting development in the first three months of 2018 has been the resurgence of Yen-strength. The Japanese Yen has had a bearish pull for much of the period since the election of Shinzo Abe in Q4 or 2012. This was being driven by the ‘three pillars’ approach to monetary policy, in which ‘Abenomics’ looked to use a combination of monetary and fiscal policy to reverse the decades-long struggle with deflation in Japan.
Initially – this worked! Inflation quickly moved above 3%, and hope quickly appeared on the horizon. But those inflation gains could not hold, and in quick order, Japan was right back to the sub-1% rates of inflation that had become commonplace for the island nation. Chinese markets began to wobble in August of 2015, and this helped to create risk aversion flows throughout global markets. This is when the Yen started to show some rather profound strength, reversing a large-portion of those QE-fueled losses; and when risk reared its ugly head again in the first part of 2016, USD/JPY spent much of the next six months moving lower. Support eventually came in around the 100.00 handle, and Yen weakness began to show again shortly after the US Presidential election. This led into the further build of a symmetrical wedge pattern that started to break this quarter.
USD/JPY Weekly Chart: The Life-Cycle of a Trend
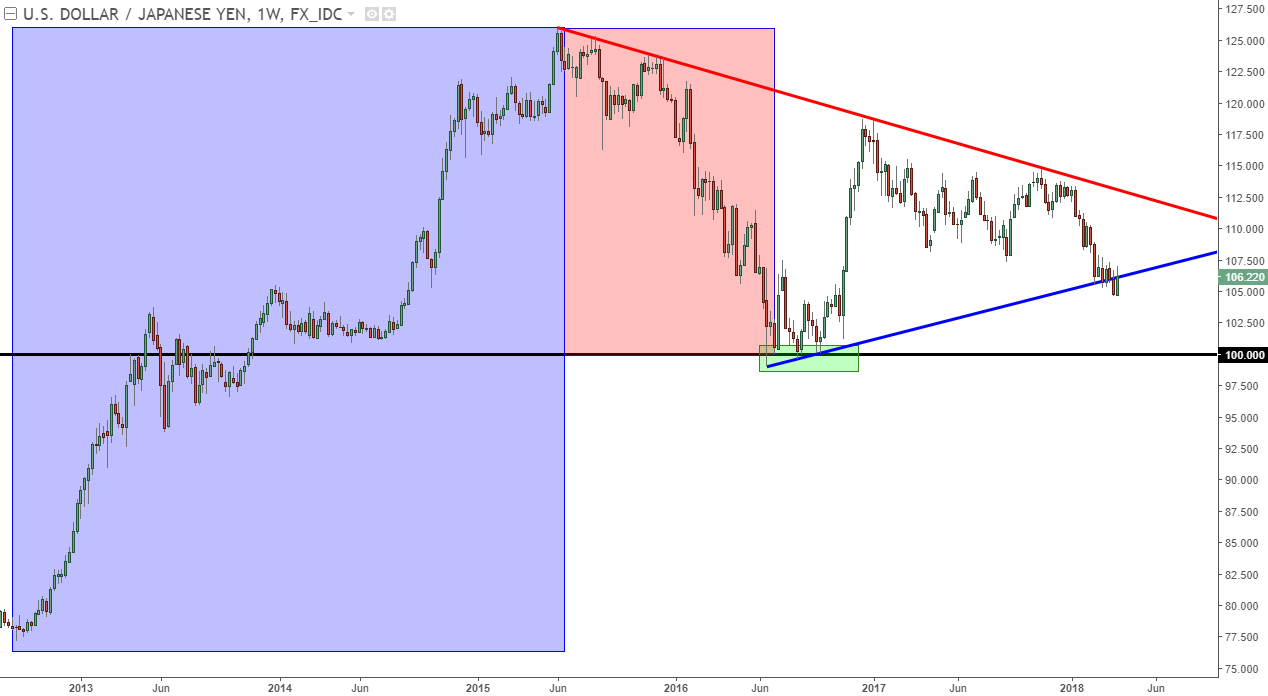
Chart prepared by James Stanley
Last year was marked by a nasty sell-off in the US Dollar. But, by and large, the Yen kept pace with the Greenback’s weakness, spending most of the last nine months in some sort of range in USD/JPY. This is saying quite a bit considering how weak the US Dollar was against other currencies such as the Euro or the British Pound, and that weakness even continued into the first month of this year; with both EUR/JPY and GBP/JPY setting fresh yearly-highs just a month into 2018.
But this theme has started to shift, as a spate of Yen strength has started to show indicating that something is shifting in the backdrop. On the below chart, we’re looking at the bearish trend that’s developed in USD/JPY so far in 2018.
USD/JPY Four-Hour Chart: Bearish Trend in USD/JPY in 2018, Lower-Lows, Highs

Chart prepared by James Stanley
Naturally, the big question here is ‘why?’ Many are pointing fingers at risk aversion, and that could certainly be a culprit, as the Yen can take preference against the US Dollar in times of heightened risk. But more likely, this has to do with the continued strength that’s showing in Japanese inflation; bringing on the possibility of another Euro-like scenario from last year with the Japanese currency.
Japanese Inflation Continues to Rise, 35-Month High at 1.5% in February

Chart prepared by James Stanley
Last year saw a dovish ECB try to avoid the topic of tightening altogether. For markets – this mattered little as the Euro continued to rally for most of the year. In Japan, those forces of inflation have just started to show and, to date, the BoJ has shown zero willingness to let go of QE or to even start thinking about what to do if and/or when that inflation target is met.
This could keep the environment ripe for Yen strength as we walk deeper into 2018. For traders looking to work with this theme, looking away from the US Dollar may bring some benefit. While the environment also appears accommodating for USD-weakness, as we looked at above, the fact of the matter is that both of these themes are rather pensive at the moment, and incorporating both in the same pair brings on considerable risks of trying to juggle two rather liquid situations with what’s going on around both the US Dollar and the Japanese Yen.
Bullish Trend Resumption Possibilities in the Euro
The Euro came into this year the same way that it finished the last one, and that’s with considerable strength. EUR/USD put in multiple tests of the 1.2500 psychological level during the period but, to date, has been unable to pose a sustained break. This hasn’t stopped bulls from remaining active in the pair, or the currency, as we’ve seen a continued response around support that’s kept those bullish trends running higher.
As we open Q2, the big question around the Euro is whether EUR/USD can overtake the 1.2500 level, and whether or not the ECB can resist the topic of tighter policy options as we move deeper into the year. The current QE program runs until September, or the end of Q3, so expect this to become a more popular topic of discussion as we move into Q2. In Q1, we saw the bank make the initial tweaks to their verbiage that may allow for further signals of ‘less loose’ policy options on the horizon, and the ECB has been very careful here, looking to avoid a run of strength in the currency that may damage the gains that have started to show with inflation.
EUR/USD Daily Chart, Psychological Resistance: Bullish Trend Hits Turbulence at 1.2500

Chart prepared by James Stanley
As we looked at above, the US Dollar appears to be in a spot for continued weakness and the Yen may be in a spot for continued gains. The Euro could be an interesting medium to look at for each of those individual themes, as we have what could be a bullish setup in EUR/USD to go along with a bearish setup in EUR/JPY.
EUR/USD
In EUR/USD, the trend has been pointing higher for almost a full year now. It was around April of last year when bulls started to have their way, and this was triggered by the resolution of the first round of French elections. When it became a bit more obvious that political upheaval was not in the immediate future for France, EUR/USD gapped-higher and never really looked back. This crafted a run that saw more than 2,000 pips added to the pair’s value, and we remain about 2,000 pips above last year’s low.
EUR/USD Four-Hour Chart: Bullish Potential as March Ushers in Higher-Highs, Lows

Chart prepared by James Stanley
The first quarter of this year was marked by range-bound price action in the pair after EUR/USD started to test 1.2500. Something similar had happened around the 1.2000 level as we walked into Q4 of last year. The big question here is one of trend resumption and whether or not this bullish setup is ready to run. We looked at a short-term setup around this theme earlier this week, and below, we take a look at the weekly chart of the pair to further focus-in on those bullish aspirations.
EUR/USD Weekly Chart: Bulls Hold the Line After Fresh Highs in Jan, Feb

Chart prepared by James Stanley
EUR/JPY
The Euro remained strong for most of 2017 here, as well. But 2018 has started to show a different tonality, as the February run of Yen strength helped to dent this bullish trend to the degree that the pair still harbors bearish potential.
The big zone of interest here runs from 131.43 up to 132.05. This was an area of support that held the lows for around five months before finally succumbing to selling pressure in February and March. This area has now started to show up as resistance, and this brings on the potential for a lower-high in the pair as bears further shift into a more aggressive mode.
EUR/JPY Daily Chart: Q4 Support Becomes Q1 Resistance

Chart prepared by James Stanley
To read more:
Are you looking for longer-term analysis on the U.S. Dollar? Our DailyFX Forecasts for Q1 have a section for each major currency, and we also offer a plethora of resources on USD-pairs such as EUR/USD, GBP/USD, USD/JPY, AUD/USD. Traders can also stay up with near-term positioning via our IG Client Sentiment Indicator.
Forex Trading Resources
DailyFX offers a plethora of tools, indicators and resources to help traders. For those looking for trading ideas, our IG Client Sentiment shows the positioning of retail traders with actual live trades and positions. Our trading guides bring our DailyFX Quarterly Forecasts and our Top Trading Opportunities; and our real-time news feed has intra-day interactions from the DailyFX team. And if you’re looking for real-time analysis, our DailyFX Webinars offer numerous sessions each week in which you can see how and why we’re looking at what we’re looking at.
If you’re looking for educational information, our New to FX guide is there to help new(er) traders while our Traits of Successful Traders research is built to help sharpen the skill set by focusing on risk and trade management.
--- Written by James Stanley, Strategist for DailyFX.com
To receive James Stanley’s analysis directly via email, please SIGN UP HERE
Contact and follow James on Twitter: @JStanleyFX


