


Talking Points
- The past 24 hours have produced two key rate decisions out of the US and UK. The Fed hiked rates as was widely-expected but continued to harbor three hikes for this year as the median expectation. This produced a move of USD-weakness that lasted into the European session this morning, at which point a bounce began to show off of the March lows.
- The fact that bulls haven’t been able to show a more definitive response seems to indicate that the general trend of USD-weakness may persist as we move into Q2. Elsewhere, cooperative counterparties in GBP and JPY appear to be showing longer-term setups that could be conducive for a continuation of weakness in the Greenback, and we look in to each of those below in GBP/USD and USD/JPY.
- Are you looking to improve your trading approach? Check out Traits of Successful Traders. And if you’re looking for an introductory primer to the Forex market, check out our New to FX Guide.
If you’re looking for short-term indicators around the US Dollar, check out our IG Client Sentiment Indicator.
Rate Hike Sell-Off in the US Dollar Finds Support at March Lows
Yesterday’s FOMC rate decision was fairly interesting as the bank hiked rates while warning that more tightening was on the way; and yet the US Dollar put in another move of weakness to break back-below the 90.00 level on DXY. While the Dollar caught a bid for the first five minutes after the release of the statement, that strength was quickly faded and the Greenback continued to head lower through Mr. Powell’s first press conference and last night’s Asian session; until a bit of support began to show around the European open. That support came-in around the 89.40 level, which is the same area that constitutes the March low in DXY, and prices have since bounced up to find resistance around a prior area of short-term trend-line support.
FOMC-Fueled Dollar Drop Finds Support at the March Lows (Hourly Chart)

Chart prepared by James Stanley
On a short-term basis, the above setup can keep the door open on both sides of the Greenback; with bulls looking for that overnight support bounce to continue back-up towards the 90.00 level; while bears have resistance at the trend-line combined with sellers showing up at prior support. This stance would be looking for fresh March lows as the US Dollar hasn’t seen much action below 89.40 since mid-February, and as we’ve looked at over the past few days, there are some interesting areas for such a theme such as GBP/USD or USD/JPY.
Powell’s First Press Conference
The press conference after yesterday’s rate hike wasn’t just Mr. Powell’s first atop the Fed, it was his first press conference ever. To say that yesterday was a change-of-pace from prior Fed meetings would be an understatement. The methodical pace and highly-theoretical explanations of economics professors Ben Bernanke and Janet Yellen have been replaced by the direct approach of a trained lawyer and investment banker in Mr. Jerome Powell. Mr. Powell seemed to dismiss long-running forecasts, and this was helpful considering the questions that could have come from the bank’s alterations to forward-looking projections on both unemployment and inflation.
As for the heart of the matter in US Dollar price action: The big trigger for selling appeared to come from the dot plot matrix and the fact that the median expectation for this year remains at three rate hikes (two more on top of yesterday’s move). This, of course, could be guided-higher; but it does remove some pressure from the bank to face the same questions around rate hikes as we approach the next quarterly meeting in June. With four hikes expected in 2018, each of those quarterly meetings becomes prime time for an adjustment. With only three as the expectation, this gives the bank some wiggle room as we move into Q2 as the Fed could look at hikes in September and December to remain on track with this year’s central expectation.
Around the US Dollar – the big question is one of a directional nature. The three hikes forecast in yesterday’s projections clearly failed to get bulls excited. Persistent weakness remains in the currency, and this is likely being driven by fiscal forces that don’t soon look to stop or even slow down.
Price action in the Dollar in the latter portion of Q1 would seem to suggest that a big move is on the horizon in one direction or the other. DXY has spent most of the period in an expanding range formation, which will often show up before a decisive move. The expanding range sees each side, both support and resistance give a little bit more as both bulls and bears get a bit more aggressive. Eventually, one side usually takes over: But which one will it be in the US Dollar?
US Dollar via ‘DXY’ Four-Hour Chart: Range Expansion Past Two Months
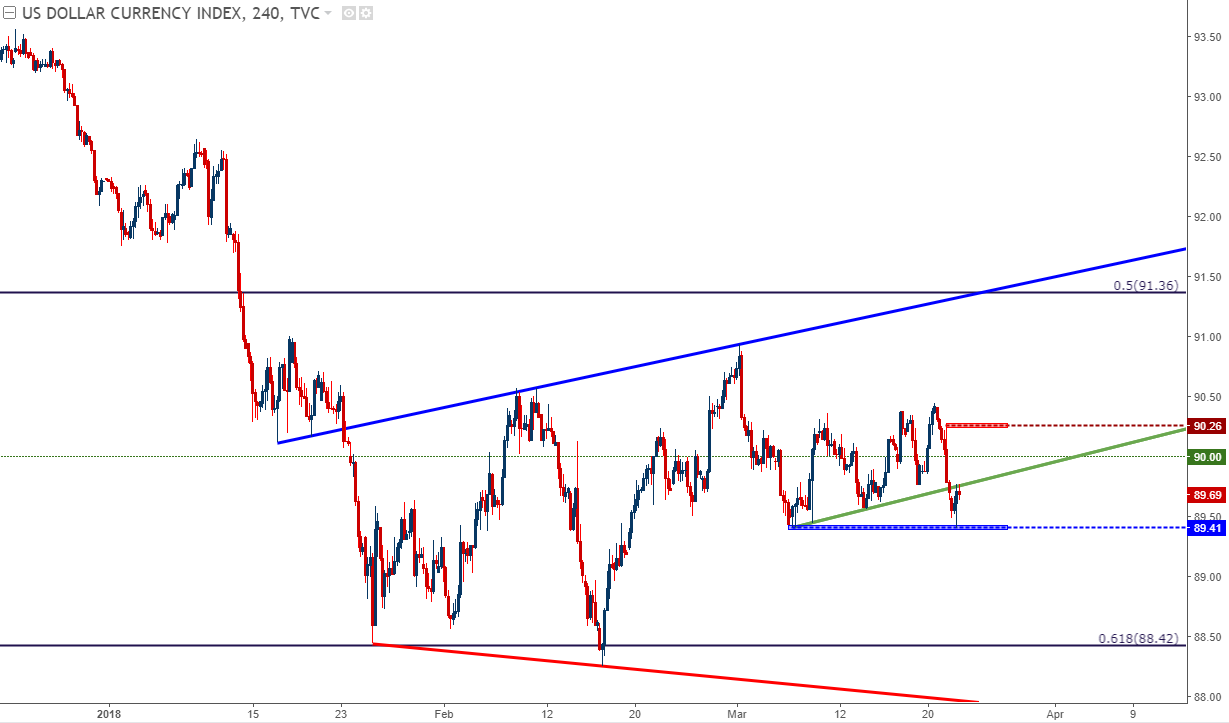
Chart prepared by James Stanley
British Pound – Rip and Dip on BoE
The Bank of England held a rate decision this morning, and expectations for anything new were extremely low. The BoE has fallen into a pattern of making policy changes at Super Thursday events, and the next of those takes place in May. As we came into this morning, the primary prerogative was gauging the bank’s tolerance for a hike at that May meeting, and all signs seemed to show support for such a move. Interesting, however, was the fact that two members voted for an immediate rate hike today, showing a 7-2 split on the vote. The initial reaction on that 7-2 number saw a quick pop of strength in GBP that was quickly faded out of markets. At this point, we’ve already moved below we were before the rate decision came-out.
The short-term bearish reversal here should be taken seriously, as the hourly bar around the BoE produced a pin bar formation, and this may be pointing to additional short-term losses before the longer-term trend is ready for resumption.
GBP/USD Hourly Chart: Bearish Reversal, Pin Bar Around BoE
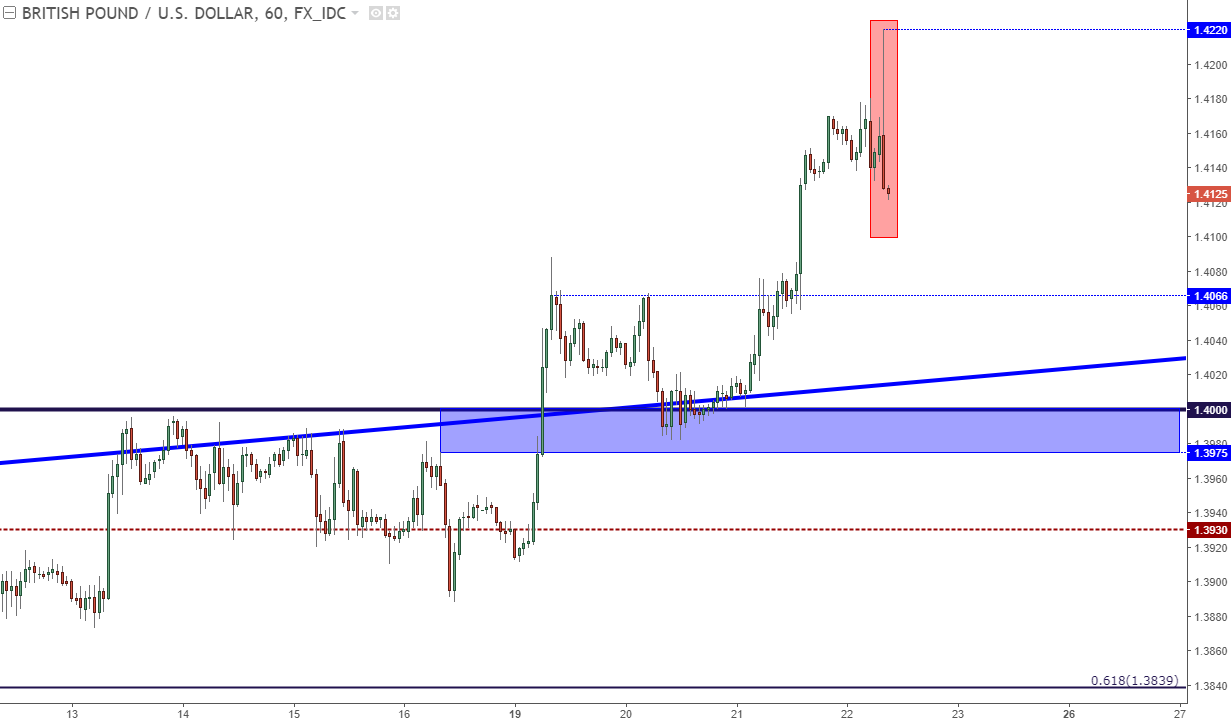
Chart prepared by James Stanley
On a slightly longer-term basis, however, GBP/USD looks attractive for continued upside. We looked at the return of the longer-term bullish trend last week. As we came into this week, the prospect of higher-low support at the key psychological level of 1.4000 opened the door for bullish continuation strategies, and price action set a high of 1.4220 on this morning’s spike.
At this point, the prospect of bullish continuation remains, and the big question is where that next area of higher-low support might come-in. We’re currently seeing sellers push prices lower, and there’s an area of interest around the 1.4070 level that we’d previously used as a topside target.
USD/JPY Approaching 15-Month Lows – Yen Threatens Bullish Breakout
Perhaps lost in the shuffle of the past couple of days is USD/JPY. We’ve been following this pair as that previously pronounced theme of Yen weakness continues to get priced-out of the market; and there’s the potential for a breakaway run of Yen strength, particularly as some of the topics around ‘tariffs’ and ‘trade wars’ steal the headlines.
USD/JPY is in the process of testing a big area of support, marked by the 15-month low which is at a confluent area of both trend-line and Fibonacci support. This area first began to get tested in early-February and, since then, has started to give way a bit more on each subsequent test. With prices now approaching those multi-month lows, might a run of break-away Yen strength be on the horizon on a print of fresh lows?
USD/JPY Four-Hour Chart: Short-Term Tests of Long-Term Support
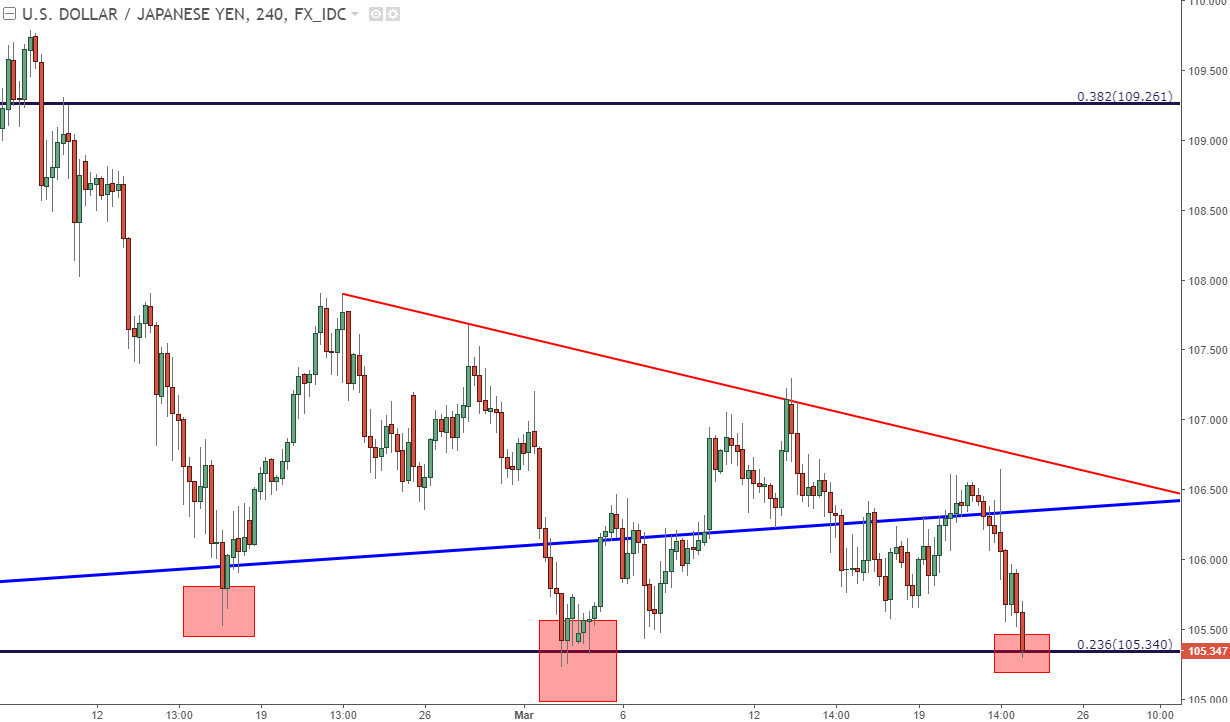
Chart prepared by James Stanley
To help put this move in scope of longer-term dynamics, we’re looking at the weekly chart below, and how this big area of support has started to bend while not having actually yet broken.
USD/JPY Weekly Chart

Chart prepared by James Stanley
A break of this support above the 105.00 level could open the door for a large down-side move, somewhat similar to what we looked at above in the US Dollar, only this scenario above offers a hint of directionality that could be utilized to incorporate two of the above themes of USD-weakness and JPY-strength. This may even bring upon a re-test of the four-year low at 99.00; although traders would likely want to look at profit targets inside of that level. On the chart below, we’ve added six such areas, each of which can be utilized as short-term profit targets should this longer-term wedge begin to show further evidence of breakdown.
USD/JPY Weekly Chart: Potential Short-Side Targets on Way Down to 99.00 Low

Chart prepared by James Stanley
To read more:
Are you looking for longer-term analysis on Gold prices? Our DailyFX Forecasts for Q1 have a section specifically for Gold. We also offer a plethora of resources on our Gold page, and traders can stay up with near-term positioning via our IG Client Sentiment Indicator.
Forex Trading Resources
DailyFX offers a plethora of tools, indicators and resources to help traders. For those looking for trading ideas, our IG Client Sentiment shows the positioning of retail traders with actual live trades and positions. Our trading guides bring our DailyFX Quarterly Forecasts and our Top Trading Opportunities; and our real-time news feed has intra-day interactions from the DailyFX team. And if you’re looking for real-time analysis, our DailyFX Webinars offer numerous sessions each week in which you can see how and why we’re looking at what we’re looking at.
If you’re looking for educational information, our New to FX guide is there to help new(er) traders while our Traits of Successful Traders research is built to help sharpen the skill set by focusing on risk and trade management.
--- Written by James Stanley, Strategist for DailyFX.com
To receive James Stanley’s analysis directly via email, please SIGN UP HERE
Contact and follow James on Twitter: @JStanleyFX


