


Talking Points:
- The U.S. Dollar is putting in bullish tendencies, showing higher-highs and lows on shorter-term charts after the aggressive bearish run in the currency throughout July.
- The bearish tally on the U.S. Dollar ran as high as -10.9% from the 2017 high on the second trading day of the year to the 2017 low, set two weeks ago.
- If you’re looking for trade ideas, check out our Trading Guides. And if you’re looking for shorter-term ideas, please check out our IG Client Sentiment.
To receive James Stanley’s Analysis directly via email, please sign up here.
In yesterday’s article, we discussed the tenuous state of the U.S. Dollar. The Dollar started the year with a jaw-dropping run of -10.9% as investors cut expectations around rate hike bets out of the Federal Reserve. As we came into 2017 flying high on the back of the ‘reflation trade’, expectations for U.S. data continued to drive-higher under the anticipation that a backdrop of stronger growth and inflation would allow the Federal Reserve to further ‘normalize’ monetary policy. The additional prospect of fiscal stimulus via tax cuts helped to offset some of the fear that was to be expected from that normalization, as bond prices remain elevated (and yields extremely low) before some of the largest players in global markets (Central Banks) stop or slow down their buying.
Matters haven’t exactly worked out that way…
Data out of the United States was simply unable to keep pace with those elevated expectations as we moved into 2017. And after the Fed’s rate hike in March, the bank began discussing the prospect of balance sheet reduction, and this seemed to really put the Dollar in a bearish mood as the idea of a dual tightening mandate, in which the Federal Reserve tightens the money supply simultaneously through rate hikes and balance sheet reduction, appeared to be a bit of a stretch. Meanwhile, the hope for tax cuts this year has dwindled as Congress was unable to make many advances on healthcare. And as this was happening, growth and inflation began to show a bit more prominently in Europe, leading many to believe that the ECB may be nearing their own exit from stimulus; and this additional strength in the Euro has helped to contribute to that back-breaking move of weakness in the Dollar.
U.S. Dollar Daily via ‘DXY’: 2017 Bearish Trend Erases Entirety of Post-Election Move
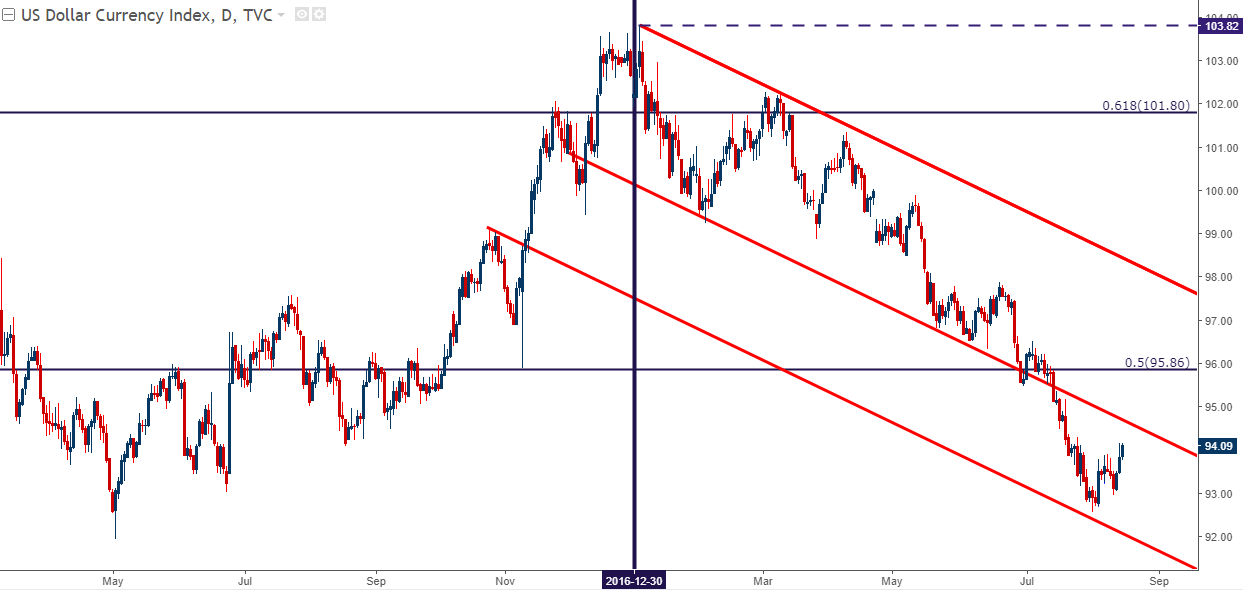
Chart prepared by James Stanley
As we came into August, the U.S. Dollar remained extremely oversold. And the dangerous part about sentiment is that when or if a market gets heavily one-sided, forward-looking data needs to be really bad to elicit even more sellers into the marketplace. And with heavy short-side sentiment, combined with diminished expectations around U.S. data, even a small or slight beat in an economic report can create a quick move of strength as shorts hurriedly try to cover positions.
This ‘short squeeze’ scenario appeared to begin showing in the Dollar in the first week of August, when Non-Farm Payrolls came out with most points of interest within the report showing something positive. This created a quick burst of strength – but sellers refused to relent, continuing to show resistance around the 93.80 level throughout last week, and pushing the Greenback-lower ahead of the weekly close after another disappointing CPI report. To close last week, and open this one – we saw buyers continuing to show support around 93.00. Yesterday’s Advance Retail Sales report came in rather strong, and this prodded another bullish move into the Greenback as the Dollar broke above the 94.00 level, albeit temporarily. But after DXY came off of resistance, buyers have showed up to offer support at prior resistance, further giving rise to the prospect of a move of strength in the U.S. Dollar as we’ve seen a continuation of short-term higher-highs and higher-lows.
U.S. Dollar Hourly via ‘DXY’: Dollar Trades to Fresh Highs, Support at Prior Resistance

Chart prepared by James Stanley
Current resistance around 94.10 is the bottom of the first zone we had looked to start last week when plotting for a U.S. Dollar recovery. Traders can use this to strategize around near-term price action in USD, necessitating a further break within the zone (fresh highs) to open the door for bullish exposure. (Updated chart shown below).
Which Areas or Markets Might be Most Attractive for Bullish USD Continuation
We discussed this quandary in our webinar yesterday, but if traders are looking to play a longer-term move of strength in USD, pair selection will be of the upmost priority. While a deeper retracement may be seen in the Euro, the single currency has been extremely strong as markets have been trying to front-run what feels like an inevitable stimulus taper/exit out of Europe. Other counterparts, such as the Yen or the Pound or even the Australian Dollar could be more attractive currencies to pair up with a bullish reversal setup in the U.S. Dollar.
USD/JPY has mirrored much of this recent movement in DXY. We’ve seen a rather brisk reversal off of last week’s lows of 108.72, and prices are currently buckling up against prior resistance around 111.00. A bullish break of last week’s high at 111.06 or, further, a break-above the Fibonacci level at 111.15 can open the door to topside continuation setups. If we get that bullish move and those fresh near-term highs, traders will likely want to wait for prices to pullback in the effort of catching ‘higher low’ support in the continuation move.
USD/JPY Hourly: V-Shaped Reversal Runs into Prior Resistance ~¥111.00
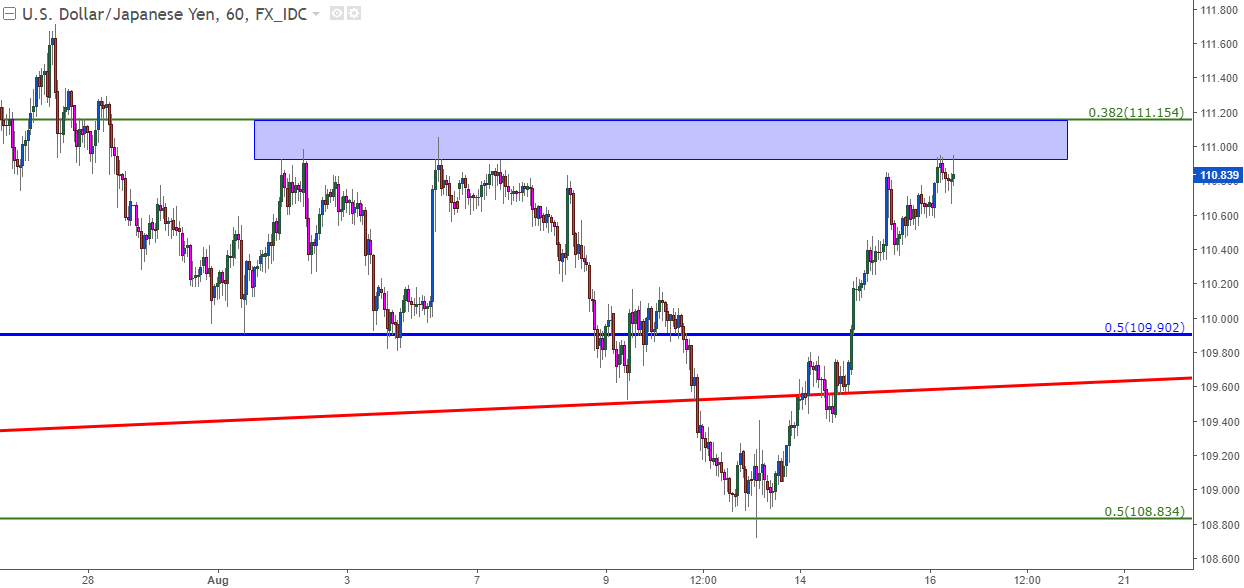
Chart prepared by James Stanley
While the Euro has been extremely strong, the British Pound has been relatively weak. One only needs to look at that bullish breakout in EUR/GBP to notice this divergence, but the dynamics of this cross-pair can be applied across USD, as well. Early-August brought us the most recent Super Thursday from the Bank of England, and after the BoE relayed a dovish stance, showing little motivation to alter policy after inflation has begun to creep-higher, Sterling bears have come back with aggression.
We looked at GBP/USD in-depth in yesterday’s technical article on the pair. The level/zone that runs from 1.2809-1.2848 is very important for GBP/USD price action, as this zone contains the prior sing-low from mid-July, as well as the 50% Fibonacci retracement of the most recent major move. As of this writing, GBP/USD is sitting on top of this zone; and a down-side break-below opens the door for short-side continuation in the pair.
GBP/USD Four-Hour: Cable Testing Trend-Line, Fibonacci Support
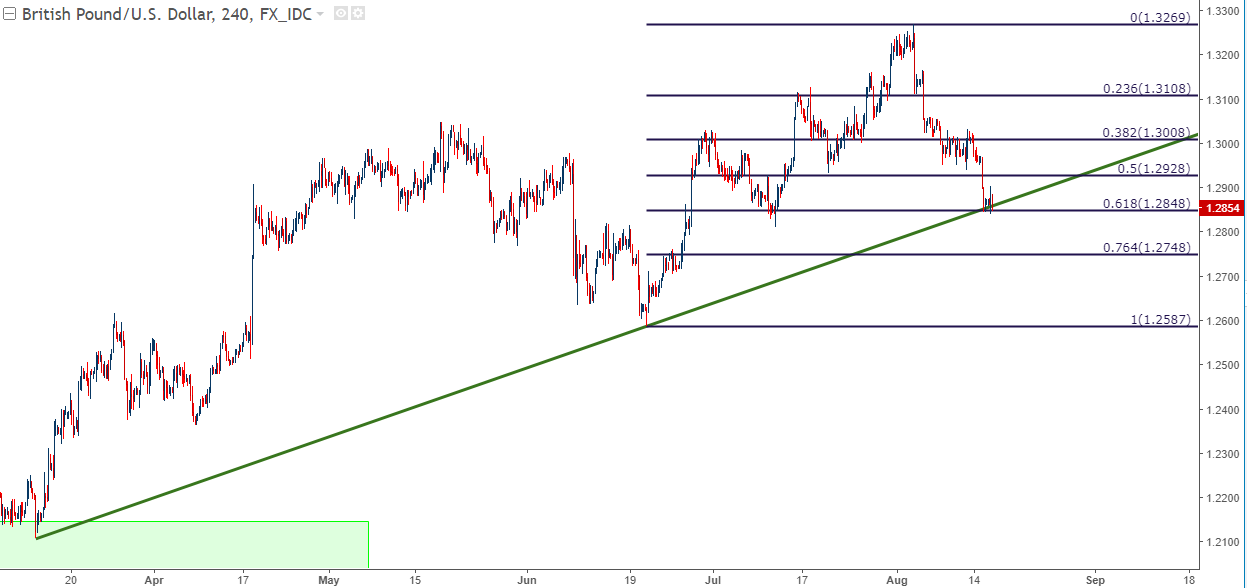
Chart prepared by James Stanley
The Aussie, meanwhile, put in what appeared to be a legitimate bullish breakout in July; resolving years of congestion after the pair built into a descending wedge pattern. Given the extreme bearish move in USD in July, this aggressive bullish move in the pair makes sense. But – if the Dollar is marking a bottom ahead of near-term gains, the potential for a reversal of that prior bullish move can remain as an interesting prospect for swing traders.
Over the past couple of weeks, AUD/USD has built into a bearish channel. Given the prior bullish move, traders can still consider this a bull flag formation. But the 50% retracement of that move is showing at .7817, and this came into play yesterday after a bit of support showed-up. If prices do break-below this 50% marker of the most recent bullish move, the door can be opened for short-side continuation under the expectation of continued Dollar-strength.
AUD/USD Hourly: Bull Flag Shows with Support at 50% Marker of July Bullish Move

Chart prepared by James Stanley
Conversely, if AUD/USD is able to break above prior swing resistance, which is showing at .7876, or the 38.2% retracement of that same major move, we’d have a top-side, bullish break of the bull flag formation after a hold of support at the 50% Fib, and this would open the door to bullish continuation strategies.
--- Written by James Stanley, Strategist for DailyFX.com
To receive James Stanley’s analysis directly via email, please SIGN UP HERE
Contact and follow James on Twitter: @JStanleyFX


