


Talking Points:
- This week is rather busy with pertinent fundamental data points being released out of Europe, the U.K., Australia and the United States.
- U.S. Dollar weakness remains as the calendar is rather brisk for U.S. data. Tuesday, Thursday and Friday all bring high-impact data points around the U.S. economy.
- If you’re looking for trade ideas, please check out our Trading Guides. And if you’re looking for shorter-term trade ideas, please check out our IG Client Sentiment.
To receive James Stanley’s Analysis directly via email, please sign up here.
European Inflation Steady – Unemployment Rate hits Eight-Year Low
Data for this week has started rather early, as we’ve already seen a couple of high-impact releases ahead of the U.S. market open. Chinese manufacturing PMI was released last night at a 51.4 read versus a 51.5 expectation; and then a couple of key European data points were released: Inflation came in-line with the 1.3% expectation, while Core CPI came in above with a 1.3% print versus a 1.1% expectation. It was the unemployment numbers that were most interesting, and Euro-Zone Unemployment hit an eight-year low at 9.1%. This would be below the 9.2% expectation, and the lowest unemployment rate for the zone since February of 2009.
This further denotes the continued improvement taking place within the European economy, and adds a bit more pressure for the ECB when they meet next in September. For much of 2017, the European Central Bank has appeared to take a stance of trying to avoid a taper tantrum as investors attempt to front-run what’s started to feel like an inevitable exit from stimulus. At ECB meetings in April, June and then July, the bank directly said that they hadn’t even discussed the prospect of exiting stimulus. But the price action response around each meeting gives the appearance that investors are growing increasingly skeptical that this is the case, and as EUR/USD remains near recently-set 2.5 year highs, it appears as though markets are expecting the ECB to begin tightening policy before long.
EUR/USD Daily Chart: Fresh 2.5 Year Highs as EUR/USD Trades Above Confluent Resistance

Chart prepared by James Stanley
The remainder of this week is rather full, and we get some important European data tomorrow with German Unemployment numbers followed by Euro-Zone GDP for the second quarter. This can produce the backdrop that could bring a pull back to this bullish trend, and on the chart below, we’re looking at three potential support areas that can be followed in the search for the ‘higher-low’ in the bullish up-trend in EUR/USD.
EUR/USD Four-Hour Chart with Potential Support Zones Applied
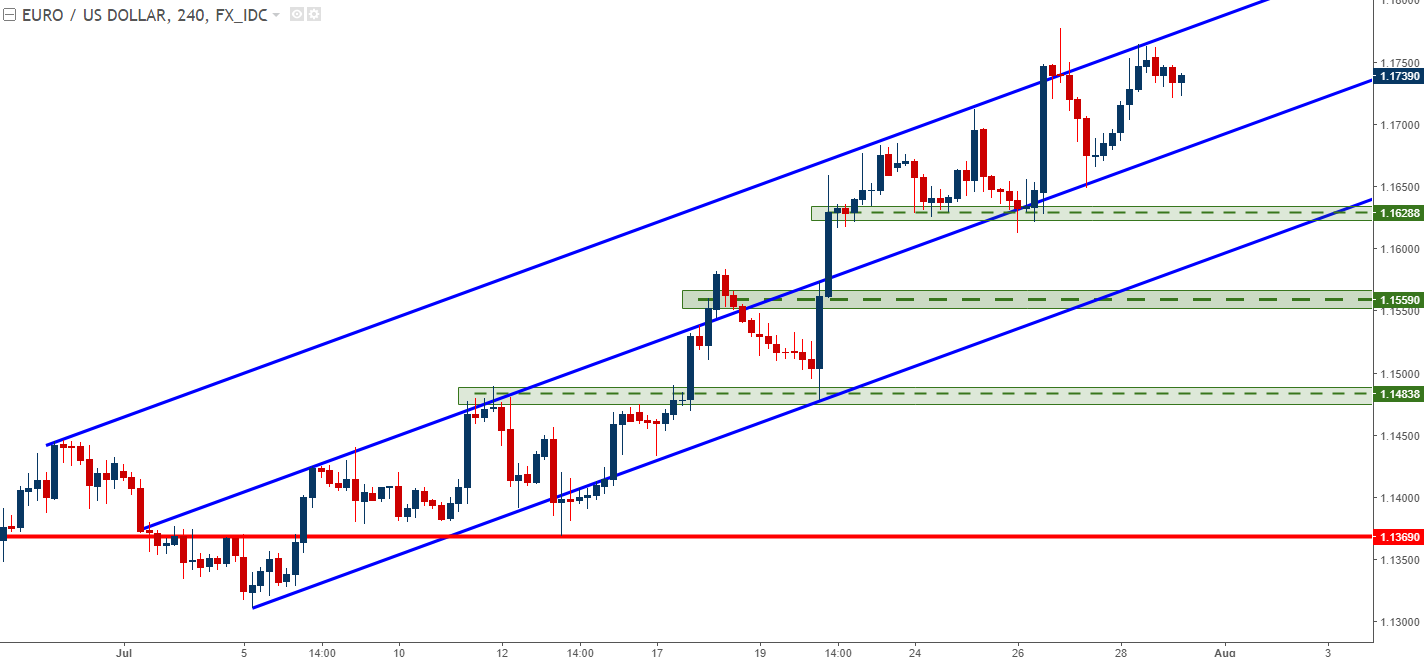
Chart prepared by James Stanley
Dollar Drop in the Spotlight with ISM, PCE and NFP
The big takeaway from last week was yet another extension of U.S. Dollar weakness around Wednesday’s FOMC meeting. At that meeting, the Federal Reserve broached the idea of balance sheet reduction by saying that they’re planning on starting ‘relatively soon’, and after that statement was released, USD went on another dive-lower to set another fresh one-year low.
But buyers showed-up above an important level last week around the 93-handle on DXY. This was the pre-Brexit swing-low, and this was the final target from our Q3 forecast on the U.S. Dollar; and a really strong U.S. Durable Goods release on Thursday helped to bring a quick iteration of strength into the Greenback, only for sellers to re-gain control on Friday morning after a disappointing GDP release. This leaves the Dollar in a rather meek position: While the move is considerably oversold, weak data combined with an uncertain outlook from the Federal Reserve has been unable to elicit the buying pressure to firmly establish a low. As we discussed in this week’s trading forecast on the Dollar, this week’s data may not need to beat expectations by all that much to produce a ‘short squeeze’ scenario, and with a rather full week of U.S. data points, that possibility certainly exists.
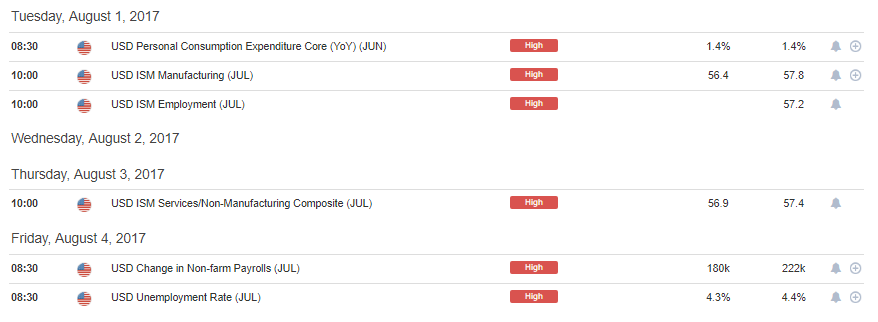
DailyFX Economic Calendar; prepared by James Stanley
Tomorrow brings PCE for June along with ISM Manufacturing and Employment from July. Thursday offers ISM Services/Non-Manufacturing while Friday brings the coup de grace of Non-Farm Payrolls. While PCE is the Fed’s preferred gauge of inflation, this number is rather laggy. So, the bigger focus will likely be paid towards NFP’s on Friday, with a special emphasis on the Average Hourly Earnings data point within the report as an indicator of wage growth in the U.S. economy.
The big level to watch on DXY is the area around 93.00. The June 2016 swing-low was at 93.02, and the low in DXY last week showed just above this price, at 93.15. If we do see a down-side break of the 93.15 level, it may not last for long as that zone around 93.00 could elicit additional buyers into the market. Whether this low remains respected this week could be telling for near-term price action in the Greenback.
U.S. Dollar via ‘DXY’ Daily Chart: Down-trend Continues, Support Above June, 2016 Swing-Low

Chart prepared by James Stanley
BoE Super Thursday to Validate/Invalidate Bullish Theme in Cable
This Thursday brings updated forecasts from the Bank of England, and this is largely thought to be the manner in which the BoE will transmit just how dovish or hawkish they are for forward-looking quarters. This is one of the more interesting Central Bank meetings for the month of August, as the BoE had appeared to be undergoing a shift within the MPC at their last rate decision, and this will be the first batch of updated forecasts that markets receive since that meeting took place.
That shift within the MCP was largely driven by inflation. In June, inflation for the month of May printed at 2.9%, and this sent some pulses racing at the BoE as the ‘sharp repricing’ in the value of the British Pound was starting to wreak consequences. At that meeting in June, we saw three MPC members dissent, instead voting in favor of rate hikes; and this was largely driven from the desire to tamp-down inflation. But in July, the next data point for inflation came-in rather tame at 2.6%. While this is still above the BoE’s 2% target, it’s well below the 2.9% print from the month prior that got expectations looking towards tighter policy.
On Thursday, we’ll hear from the BoE for the first time since that 5-3 vote. The BoE is probably not going to make any changes here, but what the bank signals in their inflation forecasts will likely set the tone for price action in GBP. If the bank increases inflation forecasts, this can be thought of as a hawkish move that can further drive that bullish trend that’s recently developed in the Pound. If inflation forecasts are moved-lower, this can be seen as a dovish move as the BoE remains rather passive towards the prospect of higher rates of inflation.
As we open the week, GBP/USD remains near ten-month highs that were set last Thursday in a follow-thru move after FOMC. Price action is in the process of resisting off of the 38.2% retracement of the post-Brexit move in GBP/USD, taking from the pre-Brexit swing-high of 1.5006 to the adjusted-low from the ‘flash crash’ of 1.1950. The 38.2% retracement of this move comes-in at 1.3117, and this has appeared to help form short-term resistance for the pair.
GBP/USD Daily: Bear Flag with Fibonacci Resistance at 38.2% of post-Brexit Move
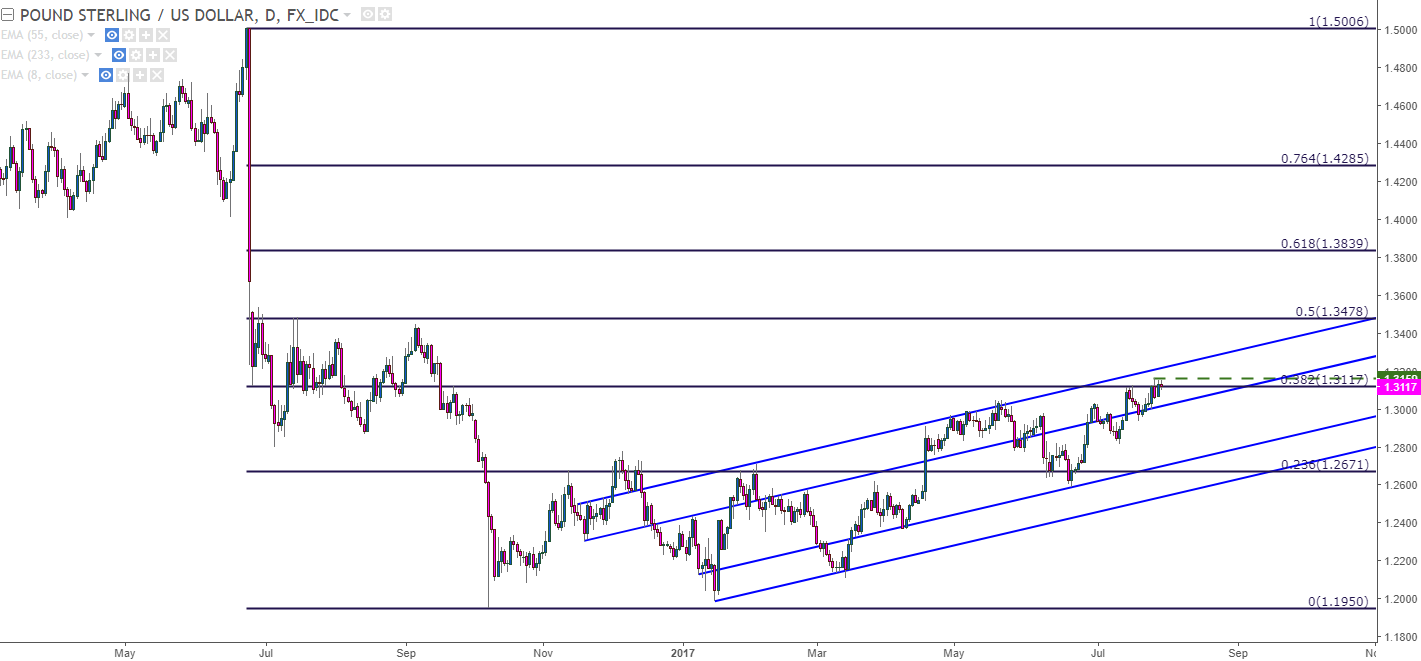
Chart prepared by James Stanley
--- Written by James Stanley, Strategist for DailyFX.com
To receive James Stanley’s analysis directly via email, please SIGN UP HERE
Contact and follow James on Twitter: @JStanleyFX


