


Talking Points:
- Next week’s calendar brings high-impact events out of the U.K., Europe and Japan, and we look at each representative market below.
- The U.S. Dollar set fresh 10-month lows this morning after another disappointing raft of U.S. data.
- Q3 Forecasts have just been released and are available in our Trading Guides. And if you’re looking for something more interactive in nature, please check out our DailyFX Live webinars.
To receive James Stanley’s Analysis directly via email, please sign up here.
This week was heavy for USD-drivers as Fed Chair Janet Yellen spent two days testifying in front of Congress for the Federal Reserve’s twice-annual Humphrey-Hawkins testimony. On Friday, we saw a couple of pain points flare as both US retail sales and CPI came-in below expectations. This has created another wave of weakness in the Greenback as the currency has slid down to set fresh ten-month lows. Meanwhile – themes of Euro and Sterling strength remain in-tact, and questions have begun to populate around the potential for a continuation of Yen weakness. Next week brings an interesting slate of data that sees drivers for each of those markets come to light, and we can move-forward with relative confidence that we’ll see some further development, in one direction or the other, on these very pensive topics. Below, we look at each.
The British Pound – U.K. Inflation on Tuesday
This is somewhat of a prelude to expectations around a Central Bank, as we’ve recently started to see the initial signs of shift towards a more-hawkish stance at the Bank of England. The driver there has been inflation: Last month we saw inflation print at 2.9% for the U.K., and this led to a 5-3 split at the BoE’s rate decision just days later in which three MPC members voted in favor of a rate hike. This was the most hawkish showing at the BoE since 2011; and when the head of the bank, Mr. Mark Carney, gave comments a week later indicating that rate hikes might be on the horizon, bullish price action began to take over in the British Pound.
Price action put in a 50% retracement of that move in the first portion of July, but over the past couple of days, bulls have re-entered the picture as traders have bid Cable back-above the vaulted 1.3000 psychological level. Should inflation print with strength on Tuesday of next week, we could certainly see continuation of this theme as traders and markets continue to attempt to get in front of a more-hawkish BoE. This would be very similar to what’s happening in Europe and the Euro at the moment, albeit at a less-developed and earlier stage.
GBP/USD Four-Hour: Bullish Break of Bull Flag After 50% Retracement
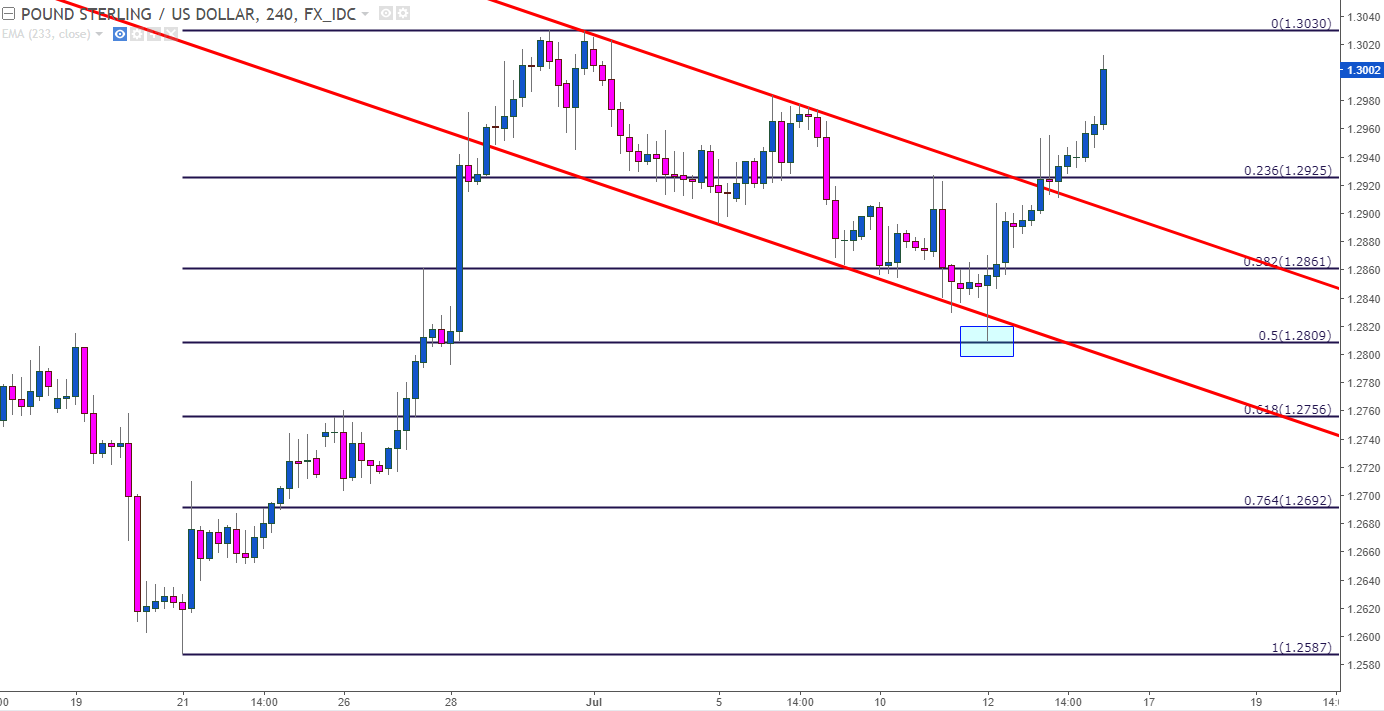
Chart prepared by James Stanley
If Cable can break above the May high of 1.3048, we’ll have fresh 14-month highs to work with, and this can open the door to bullish continuation strategies as the theme of a more-hawkish BoE as driven by stronger inflation continues to elicit bids in the British Pound.
We are currently long in GBP/USD from an Analyst Pick set yesterday in which we paired up long Cable with long USD/JPY. On the chart below, we’re looking at three areas to watch for the continued development of bullish price action in the pair. If prices drop below the 1.2809 level that had helped to set support earlier in the week, the bullish stance will no longer be warranted.
GBP/USD Hourly Chart with Potential Support Zones Applied

Chart prepared by James Stanley
The Euro – ECB is on Thursday
The past two European Central Bank meetings have seen ECB President Mario Draghi echo a very familiar dovish tone. While growth and inflation have been moving-higher in Europe for much of the year, the ECB President has shown no clear signs of abating from the dovish stance that saw the bank enact a massive QE outlay. As inflation has started to show consistent strength, we’ve started to hear from other sources in Europe that would like to see an end of QE, but at each opportunity, Draghi has tried to talk the currency back-down.
Two weeks ago in Sintra, Mr. Draghi had a speech in which he said that the ECB could tweak the parameters of their QE program. This was widely-inferred to mean tapering, or starting the process of exiting from stimulus; but a day later an ECB source remarked that these comments were misinterpreted as Mr. Draghi’s objective was to issue balanced remarks with no clear signs of stimulus exit. Markets seemingly didn’t care – as the bullish trend that’s seen EUR/USD rise by more than 1,000 pips in 2017 remains active and intact.
EUR/USD Daily: A Bullish 2017, thus far
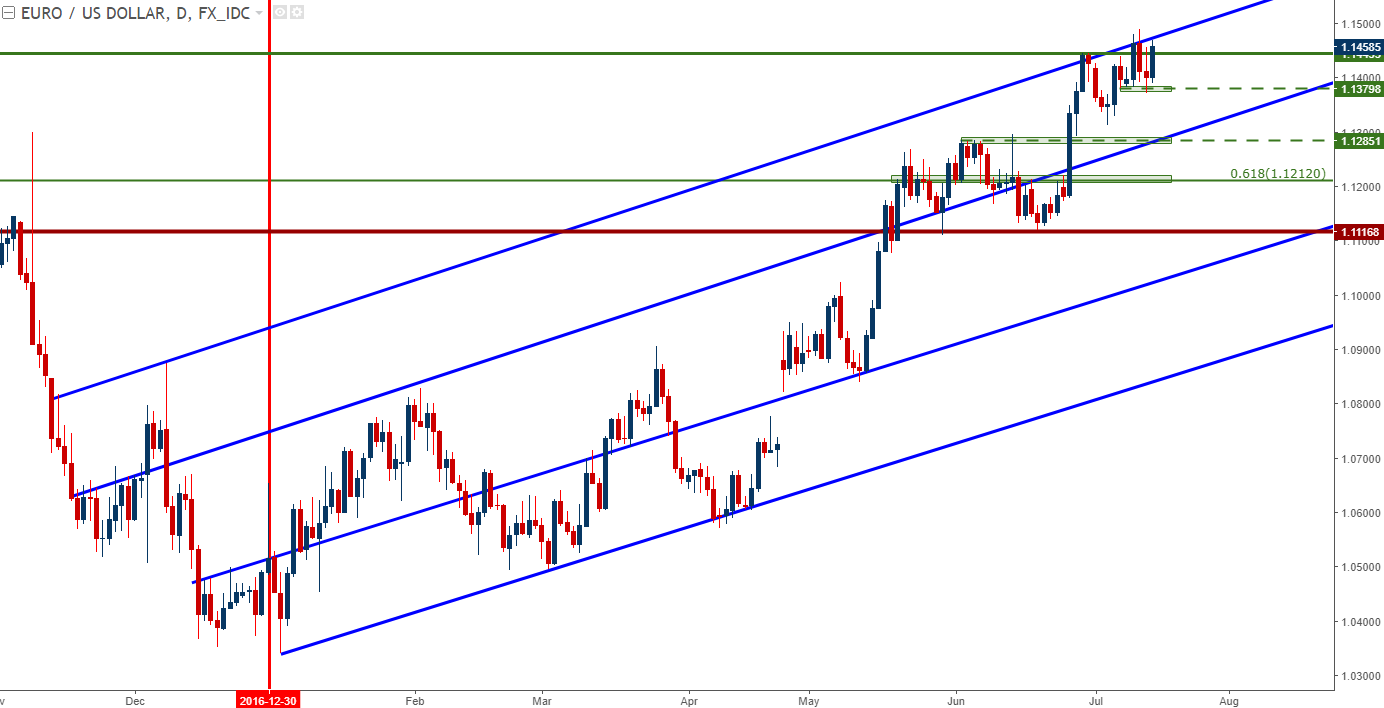
Chart prepared by James Stanley
Last week saw EUR/USD break-above a bull flag formation after catching support at a key Fibonacci level. Prices trickled-higher to set a fresh 14-month high, but buyers were unable to drive above the psychological level of 1.1500, and current resistance is showing at the top of the EUR/USD 2017 bullish trend channel. But buyers have yet to let-up: We had identified three support levels for the pair earlier in the week, and the first of those levels had continued to hold the short-term lows.
Thursday of next week brings another European Central Bank meeting. There will be no updated forecasts, and there is little expectation for any actual changes. So, we’ll likely be working with a heavy dose of inference around the press conference with Mr. Draghi on Thursday morning.
We are currently long EUR/USD, with one target remaining from the Analyst Pick from last week.
The Yen – BoJ on Thursday
The Japanese Yen has been one of the few major currencies that’s actually shown some signs of weakness against U.S. Dollar over the past month. After bottoming-out at around 108.80 in the middle of June, the Japanese Yen embarked on a path of weakness that lasted all the way up to this week. But as that additional wave of weakness in the Greenback took over around Fed Chair Janet Yellen’s testimony and then the disappointing slate of prints on Friday, the trend put in a retracement of the recent bullish move, and we’re currently seeing prices catching support at the 38.2% retracement of that move.
USD/JPY Four-Hour: Support Showing After a 38.2% Retracement
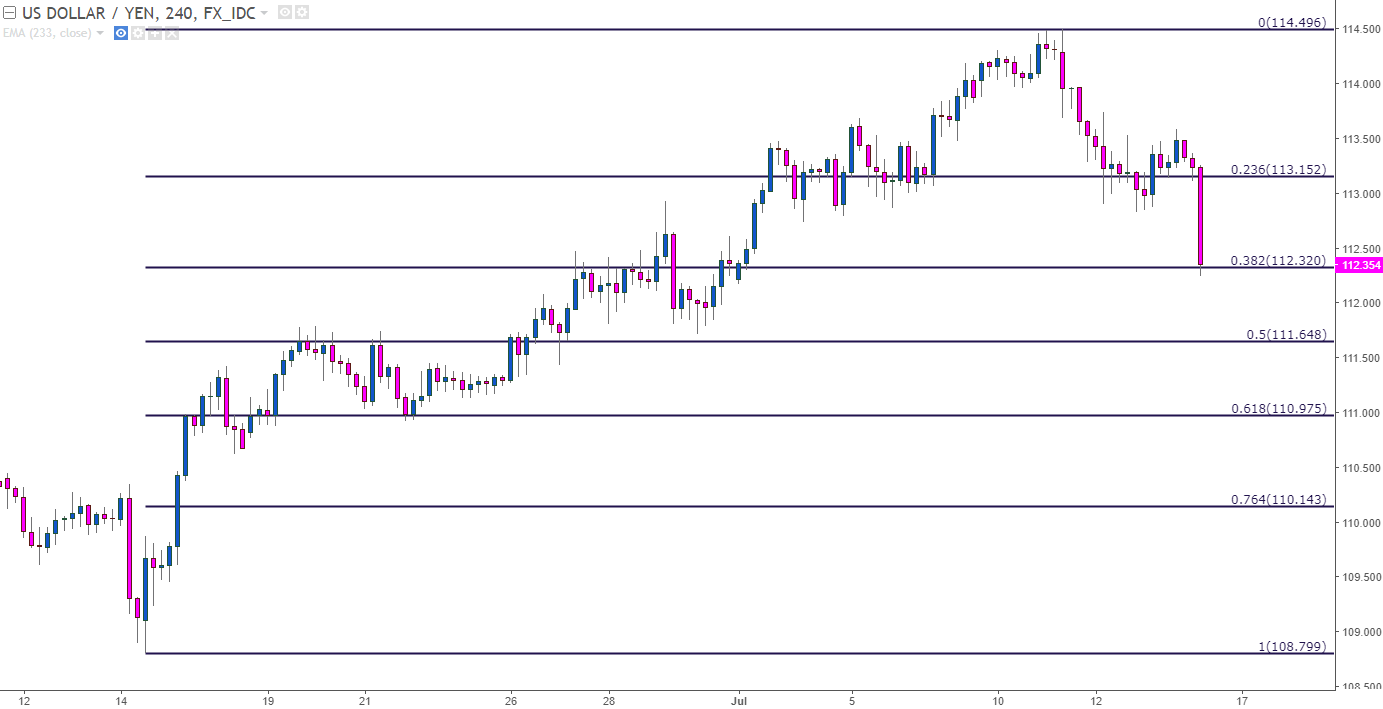
Chart prepared by James Stanley
The Bank of Japan has a rate decision scheduled for Thursday morning, and the big question here is whether the BoJ will be able to elicit another wave of weakness in the Yen. The longer-term setup in USD/JPY is very interesting, as this recent slump in the bullish trend has brought price action down to a key zone of support/resistance that resides from 111.61-112.40.
We are currently long USD/JPY from an Analyst Pick set yesterday.
USD/JPY Daily: Falls into Confluent Zone of Long-Term Support/Resistance
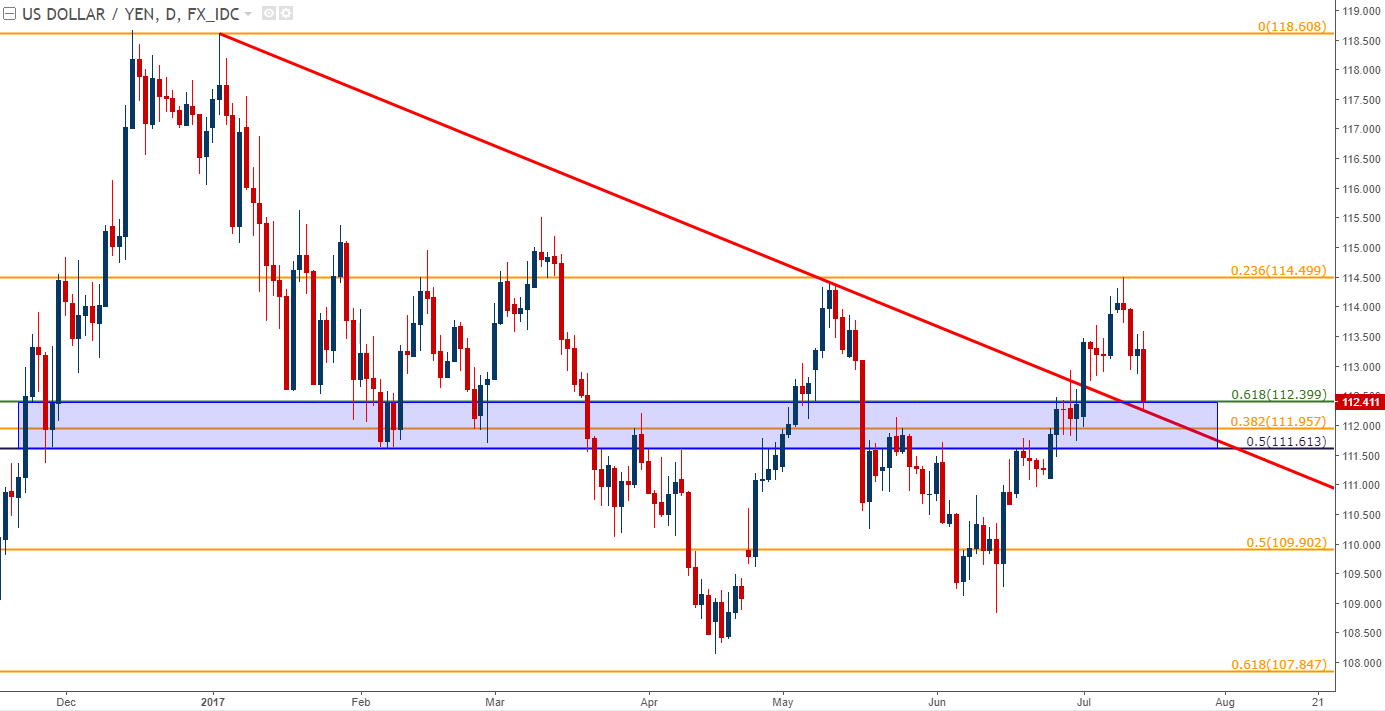
Chart prepared by James Stanley
--- Written by James Stanley, Strategist for DailyFX.com
To receive James Stanley’s analysis directly via email, please SIGN UP HERE
Contact and follow James on Twitter: @JStanleyFX


