To receive James Stanley’s Analysis directly via email, please sign up here.
Talking Points:
- GBP/USD Technical Strategy: Mixed longer-term, bullish short-term.
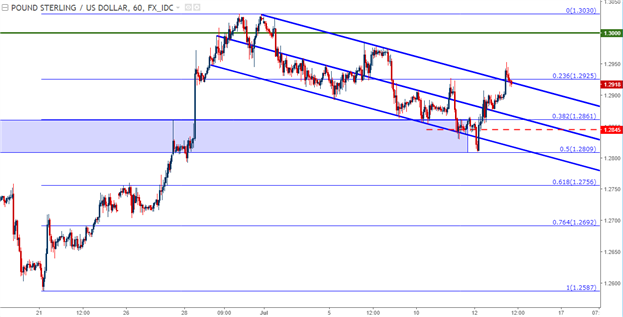
- GBP/USD has posed a topside break of a bull flag formation.
- If you’re looking for trading ideas, check out our Trading Guides. They’re free and updated for Q1, 2017. If you’re looking for ideas more short-term in nature, please check out our IG Client Sentiment.
In our last article, we looked at the prospect of bullish continuation in GBP/USD. After the pair put in a very strong move in the latter portion of June, the stage was set for continuation, and in our last article we looked at a zone of potential support to trade such a theme that ran from 1.2809 up to 1.2861. With an apparent shift taking place within the Bank of England’s MPC, and with an extremely weak U.S. Dollar, there were quite a few reasons for so much interest to draw around the trade.
As we turned the page into Q3 at the beginning of July, profit taking had started in Cable and the pair spent most of the first part of the month trending-lower within a downward sloping channel. This created a bull flag formation as recent gains were digested in a rather formulaic fashion, and prices remained in that channel for much of the period until support came-in at the bottom of our zone at 1.2809.
GBP/USD Hourly Chart: Bull Flag with Bullish Break

Chart prepared by James Stanley
After buyers took over following that test of 1.2809, the pair has begun to show bullish price action as prices have driven-above the downward sloping channel, giving us a topside break of the bull flag formation. This can open the door to long exposure, and on the chart below, we’re looking at three nearby support levels that buyers can use to base topside approaches. Each of these levels can be used for potential support, or perhaps even stop placement for those that would like to manage their risk a bit more aggressively. A red box has been placed over the low around 1.2809, and if prices break below this level, the bullish approach is nullified.

Chart prepared by James Stanley
--- Written by James Stanley, Strategist for DailyFX.com
To receive James Stanley’s analysis directly via email, please SIGN UP HERE
Contact and follow James on Twitter: @JStanleyFX


