


- US Dollar recovery targeting resistance at former support- risk is lower sub-98.11
- Check out our 2019 projections in our Free DailyFX USD Trading Forecasts
- Join Michael for Live Weekly Strategy Webinars on Mondays at 12:30GMT
The US Dollar plummeted more than 2.5% off the yearly/monthly high before rebounding and we’re on the lookout for exhaustion on this recovery in the days ahead. These are the updated targets and invalidation levels that matter on the DXY price charts. Review my latest Weekly Strategy Webinar for an in-depth breakdown of this Sterling price setup and more.
New to Forex Trading? Get started with this Free Beginners Guide
US Dollar Index Price - DXY Daily
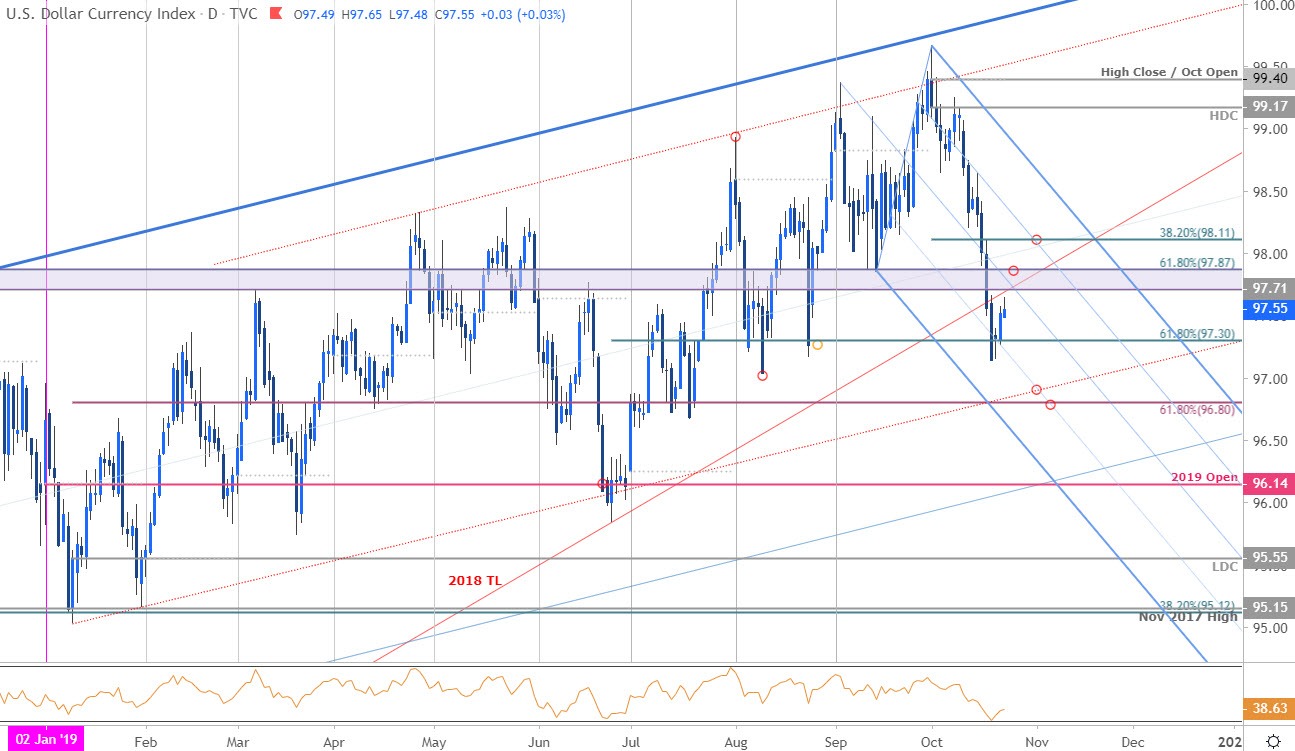
Chart Prepared by Michael Boutros, Technical Strategist; DXY on Tradingview
Technical Outlook: In my latest USD Dollar Weekly Price Outlook we noted that DXY had, “turned from BIG resistance this month with the decline now testing multi-year slope support…. look for exhaustion on a recovery while below the high-week close with a break lower likely to fuel accelerated losses in the greenback.” Price broke below the 2018 trendline last week with the recent recovery now eyeing resistance at former trend support.
Initial resistance stands at 97.71/87 – a zone of interest for possible exhaustion. Broader bearish invalidation now lowered to the 38.2% retracement at 98.11. A break below last week’s low keeps the focus on the 97-handle and more significant support at the 61.8% retracement at 96.80- look for a bigger reaction there If reached.
US Dollar Index Price - DXY 120min
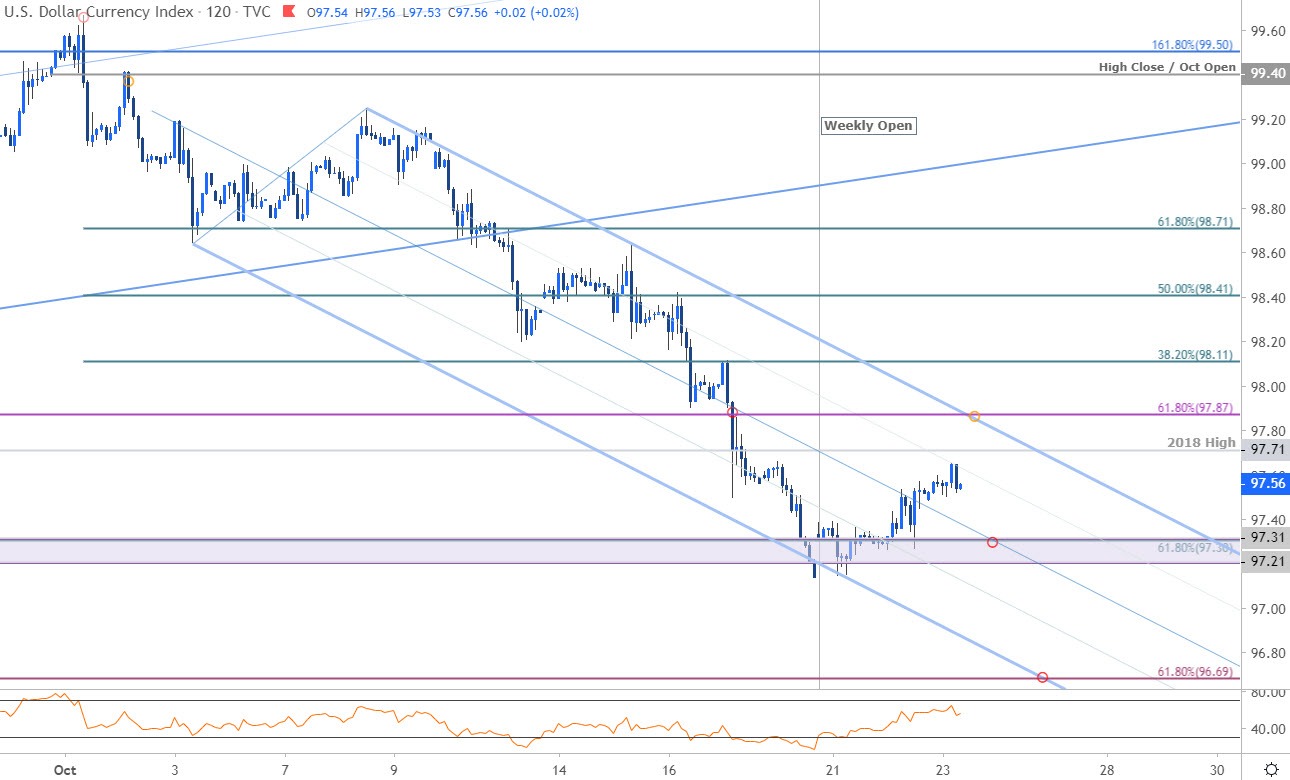
Notes: A closer look at US Dollar price action shows DXY trading within the confines of a near-term descending pitchfork formation extending off the monthly highs with the index rebounding off confluence support at the lower parallels early in the week. Look for exhaustion heading into the upper parallels with a break below 97.21 needed to fuel the next leg lower in price.
Why does the average trader lose? Avoid these Mistakes in your trading
Bottom line: The dollar is rebounding off near-term downtrend support and we’re on the lookout for exhaustion just higher. From at trading standpoint the risk remains weighted to the downside while within this formation– look for short-entries / fade strength on a test of the upper parallel with a break below the weekly opening-range lows needed to keep the immediate short-bias viable. A close above 98.11 would ultimately be needed to shift the broader focus back to the topside.
For a complete breakdown of Michael’s trading strategy, review his Foundations of Technical Analysis series on Building a Trading Strategy
Active Trade Setups
- Sterling Price Outlook: British Pound Tests 1.30– Cable Break or Bend
- Canadian Dollar Price Outlook: USD/CAD Plummets to Fresh Weekly Lows
- Gold Price Targets: XAU/USD Range Breakout Imminent- GLD Outlook
- Japanese Yen Price Outlook: USD Reversal Risks Deeper USD/JPY Losses
- Euro Price Outlook: EUR/USD Stalls into Monthly Open- Bears Beware
- Written by Michael Boutros, Currency Strategist with DailyFX
Follow Michael on Twitter @MBForex


