


- British Pound breakout stalling into 1.30- constructive while above 1.27
- Check out our 2019 projections in our Free DailyFX GBP/USD Trading Forecasts
- Join Michael for Live Weekly Strategy Webinars on Mondays at 12:30GMT
Sterling prices surged more than 6.6% against the US Dollar off the yearly lows with the British Pound breakout now stalling around the 1.30-handle early in the week. The immediate advance may be vulnerable here, but the broader focus remains constructive after last week’s breakout. These are the updated targets and invalidation levels that matter on the GBP/USD price charts. Review my latest Weekly Strategy Webinar for an in-depth breakdown of this Sterling price setup and more.
New to Forex Trading? Get started with this Free Beginners Guide
Sterling Price Chart - GBP/USD Daily
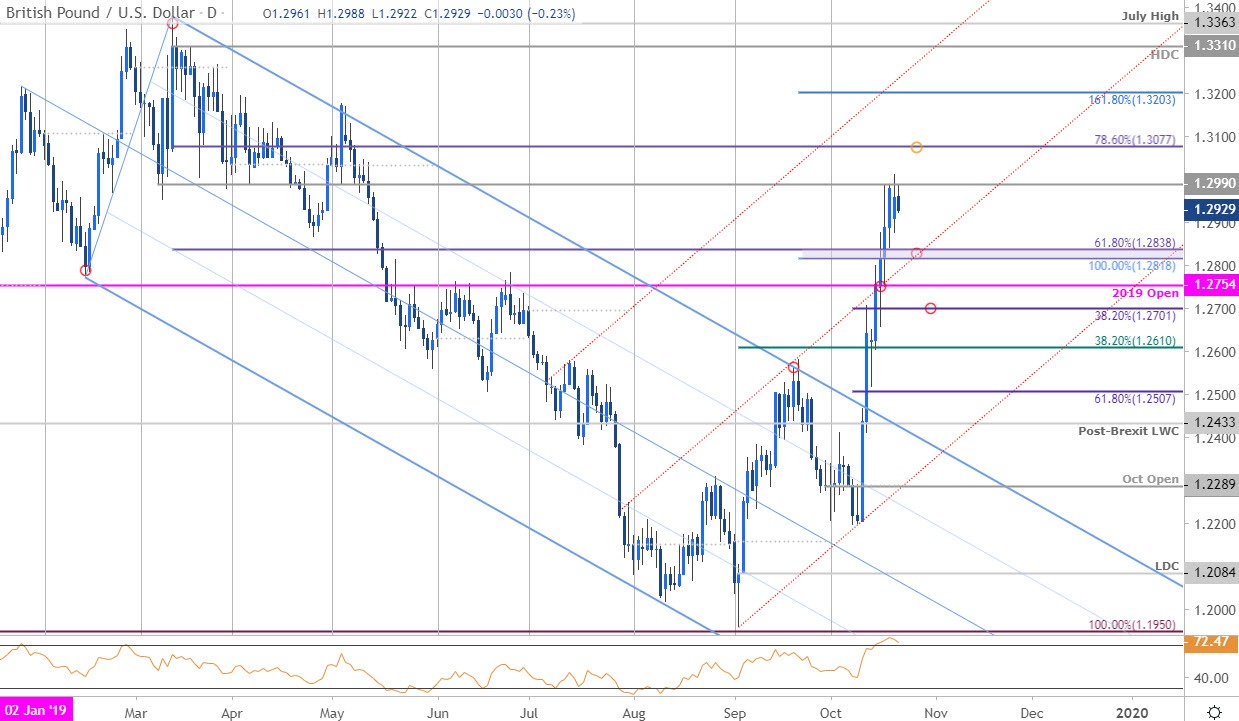
Chart Prepared by Michael Boutros, Technical Strategist; GBP/USD on Tradingview
Technical Outlook: In my latest British Pound PriceOutlook we noted that the, “we’ll favor fading weakness on while above 1.2389.” Sterling has rallied more than 5.8% off the monthly / yearly lows with the advance now testing soft resistance here at 1.2990. GBP/USD is poised to snap 5-days of consecutive gains today (and only the second down-day in nine) with the rally looking a bit vulnerable in early US trade.
Initial support rests at the confluence of the 61.8% retracement of the yearly range and the 100% extension of the advance off the yearly lows at 1.2818/38 with the yearly open just lower at 1.2754- look for a reaction off one of these levels IF reached. A topside breach keeps the focus on 1.3077 and the 1.32-handle .
Sterling Price Chart – GBP/USD 120min
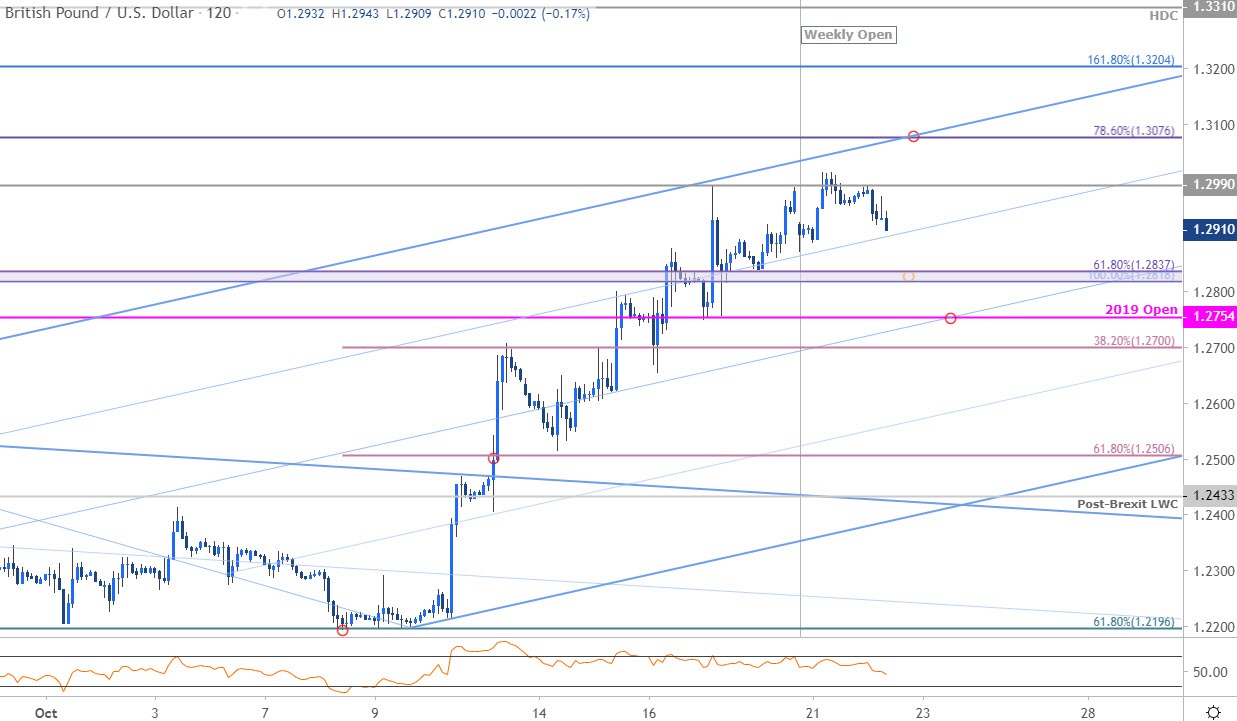
Notes: A closer look at Sterling price action shows GBP/USD trading within the confines of an ascending pitchfork formation extending off the September/October lows with price setting the weekly opening-range just below the upper parallel. Initial support rests at 1.2818/37 and 1.2754 with near-term bullish invalidation set to the 1.27-handle.
A topside breach of the weekly range highs keeps the focus on 1.3076 and the upper parallel – a close above this threshold would likely fuel accelerated gains in the Pound with such a scenario targeting 1.3204 and the high-day close at 1.3310.
Why does the average trader lose? Avoid these Mistakes in your trading
Bottom line: Sterling is approaching near-term uptrend resistance and leaves the immediate advance vulnerable heading into the upper parallel. Look for possible exhaustion up here with a set-back to offer more favorable entries. From a trading standpoint, look to reduce long-exposure / raise protective stops on a move towards the upper parallel – we’ll favor fading weakness while within this formation ultimately targeting a breach towards 1.33. Review my latest Sterling Weekly Outlook for a closer look at the longer-term GBP/USD technical trading levels.
For a complete breakdown of Michael’s trading strategy, review his Foundations of Technical Analysis series on Building a Trading Strategy
Sterling Trader Sentiment - GBP/USD Price Chart
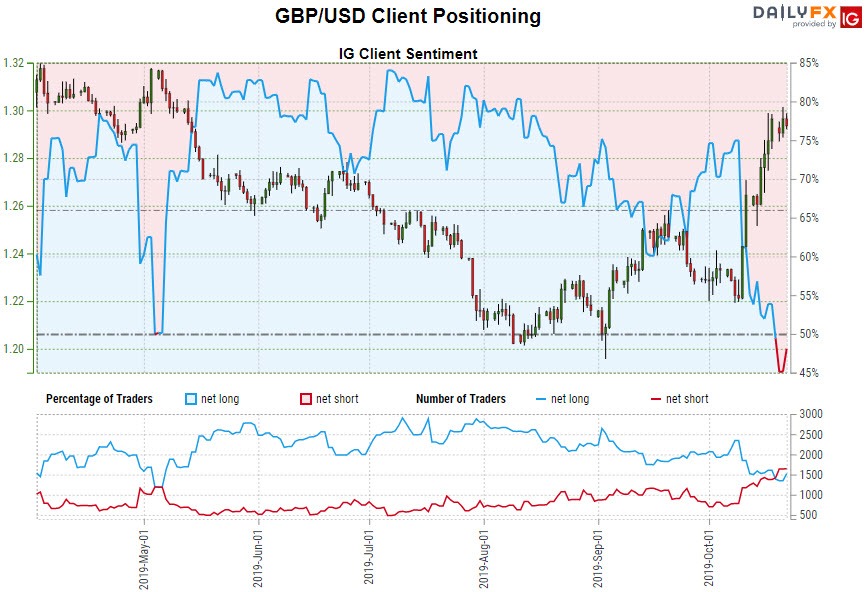
- A summary of IG Client Sentiment shows traders are net-short GBP/USD - the ratio stands at -1.03 (49.22% of traders are long) – neutral reading
- Long positions are 11.91% higher than yesterday and 0.80% lower from last week
- Short positions are 1.13% lower than yesterday and 38.34% higher from last week
- We typically take a contrarian view to crowd sentiment, and the fact traders are net-short suggests GBP/USD prices may continue to rise. Traders are less net-short than yesterday but more net-short from last week and the combination of current positioning and recent changes gives us a further mixed GBP/USD trading bias from a sentiment standpoint.
See how shifts in GBP/USD retail positioning are impacting trend- Learn more about sentiment!
---
Active Trade Setups
- Canadian Dollar Price Outlook: USD/CAD Plummets to Fresh Weekly Lows
- Gold Price Targets: XAU/USD Range Breakout Imminent- GLD Outlook
- Japanese Yen Price Outlook: USD Reversal Risks Deeper USD/JPY Losses
- Euro Price Outlook: EUR/USD Stalls into Monthly Open- Bears Beware
- Written by Michael Boutros, Currency Strategist with DailyFX
Follow Michael on Twitter @MBForex


