


- USD/CAD weekly technicals – price in multi-month consolidation below critical resistance
- Check out our 2019 projections in our Free DailyFX USD Trading Forecasts
- Join Michael for Live Weekly Strategy Webinars on Mondays at 12:30GMT
In this series we scale-back and look at the broader technical picture to gain a bit more perspective on where we are in trend. The Canadian Dollar is virtually unchanged against the US Dollar since the start of the year with price continuing to trade within the initial yearly opening range just below a critical resistance zone. These are the updated targets and invalidation levels that matter on the USD/CAD weekly price chart. Review this week’s Strategy Webinar for an in-depth breakdown of this setup and more.
New to Forex Trading? Get started with this Free Beginners Guide
USD/CAD Weekly Price Chart

Notes: In my previous USD/CAD Weekly Technical Outlook we noted that we were, “looking for a pivot off the 1.3435/37 confluence resistance zone with the immediate long-bias vulnerable while below. From a trading standpoint, a good place to reduce long exposure / raise protective stops and be on the lookout for possible price exhaustion.” Nearly five weeks later and price has continued to respect this key threshold with weekly momentum flat-lining just above 50.
A topside breach of this formation would once again target the 2017 high-week close / 61.8% retracement at 1.3686 (key) backed by the 2017 high at 1.3793. Weekly support rests at the highlighted confluence zone around 1.3149/90 where the 2012 & 2018 trendlines converges on the 52-week moving average at. A break below this threshold would shift the focus towards more significant support zone at 1.3052/98- a region defined by the 61.8% extension of the late-2018 decline, the 38.2% retracement of the 2017 advance and the 200-week moving average. Look for a stronger reaction there IF reached with a break lower exposing 1.2871.
For a complete breakdown of Michael’s trading strategy, review his Foundations of Technical Analysis series on Building a Trading Strategy
Bottom line: USD/CAD remains within a range just below a critical resistance confluence at 1.3435/37 and the focus is on a reaction off this mark. From a trading standpoint, the daily chart shows price marking a series of lower highs / higher lows and we’re looking for a break of the consolidation off the March highs for guidance. Ultimately, a topside breach is favored but in the near-term, another test of slope support may be on the cards first. I’ll publish an updated USD/CAD Price Outlook once we get further clarity in near-term price action.
Even the most seasoned traders need a reminder every now and then- Avoid these Mistakes in your trading
USD/CAD Trader Sentiment

- A summary of IG Client Sentiment shows traders are net-long USD/CAD - the ratio stands at +1.03 (50.7% of traders are long) – neutral reading
- Long positions are 10.3% lower than yesterday and 28.1% higher from last week
- Short positions are 4.3% higher than yesterday and 18.2% lower from last week
- We typically take a contrarian view to crowd sentiment, and the fact traders are net-long suggests USD/CAD prices may continue to fall. Yet, traders are less net-long than yesterday but more net-long from last week and the combination of current positioning and recent changes gives us a further mixed USD/CAD trading bias from a sentiment standpoint.
See how shifts in USD/CAD retail positioning are impacting trend- Learn more about sentiment!
---
Relevant US / Canada Economic Data Releases
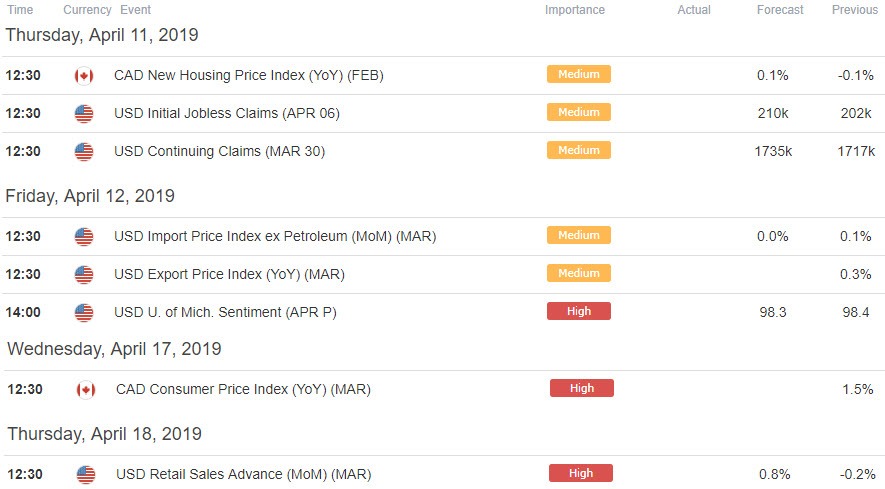
Economic Calendar - latest economic developments and upcoming event risk. Learn more about how we Trade the News in our Free Guide!
Previous Weekly Technical Charts
- Crude Oil (WTI)
- US Dollar (DXY)
- British Pound (GBP/USD)
- Gold (XAU/USD)
- Australian Dollar (AUD/USD)
- New Zealand Dollar (NZD/USD)
- Euro (EUR/USD)
Learn how to Trade with Confidence in our Free Trading Guide
--- Written by Michael Boutros, Technical Currency Strategist with DailyFX
Follow Michael on Twitter @MBForex


