
S&P 500 OUTLOOK:
- S&P 500 charges higher after struggling for direction for much of the day
- Utilities shine while some cyclical sectors underperform
- Oil prices remain defensive on mounting recession fears
Trade Smarter - Sign up for the DailyFX Newsletter
Receive timely and compelling market commentary from the DailyFX team
Most Read: Euro Price Action Setups - EUR/USD, EUR/JPY and EUR/CHF
After struggling for direction for much of the day, the S&P 500 charged higher in late trading, rising 0.36% to end the session at 3,845, with utilities leading the advance and cyclicals underperforming amid concerns that the U.S. economy is teetering on the brink of a recession. Fears of an economic hard landing have hammered growth-sensitive commodities and stocks in recent weeks, sparking a major sell-off in some corners of the market.
Energy stocks, for example, have plunged of late, closely tracking weakness in oil and natural gas prices. In this context, the XLE ETF, a fund that invests in the energy universe, has sunk nearly 30% over the past month, despite the positive EPS outlook for companies in the space. For context, both WTI and Brent benchmarks have corrected sharply lower recently on speculation that a global downturn would reduce fossil fuel demand significantly in the coming quarters, though the decline was also exacerbated by panic-selling, technicals and low trading liquidity.
Although decelerating economic activity may dampen oil consumption, the latest correction appears extreme, considering that markets remain structurally in deficit amid limited ability of key producers to boost supplies. Against this backdrop, it would not be surprising if WTI and Brent were to stage a meaningful rebound in the near term or, at least, stabilize, paving the way for energy shares to retrace losses sustained in June and July.

Taking a broader view, the worst may not yet be over for Wall Street. Aside from energy companies, most firms are likely to report disappointing results and, in many cases, begin issuing profit warnings for the year when the second-quarter reporting period begins in earnest next week. Negative earnings surprises, coupled with poor guidance, could deal another blow to equities, triggering the next leg lower in the S&P 500.
Slowing growth, caused in part by the Fed’s hiking cycle, will create an unfriendly backdrop for most stocks over the medium term, even if the tightening process is aimed at achieving a greater good - controlling inflation. While U.S. yields have been moving downwards in recent days on bets that the FOMC will reverse course to prevent a hard landing that could have major ramifications for the economy, there are no indications that the central bank will blink yet.
The June FOMC minutes, released earlier today, seem to validate the previous point. The account of that meeting showed that the bank remains intent on tackling inflation, with officials asserting that elevated CPI readings warrant restrictive interest rates, while flagging that more aggressive action could be taken if the inflationary environment worsened. These observations suggest that policymakers are prioritizing price stability over economic growth concerns, signaling there is room for market expectations to realign with the Fed hawkish message, a bearish scenario for risky assets.
| Change in | Longs | Shorts | OI |
| Daily | 1% | -1% | 0% |
| Weekly | 15% | -13% | -1% |
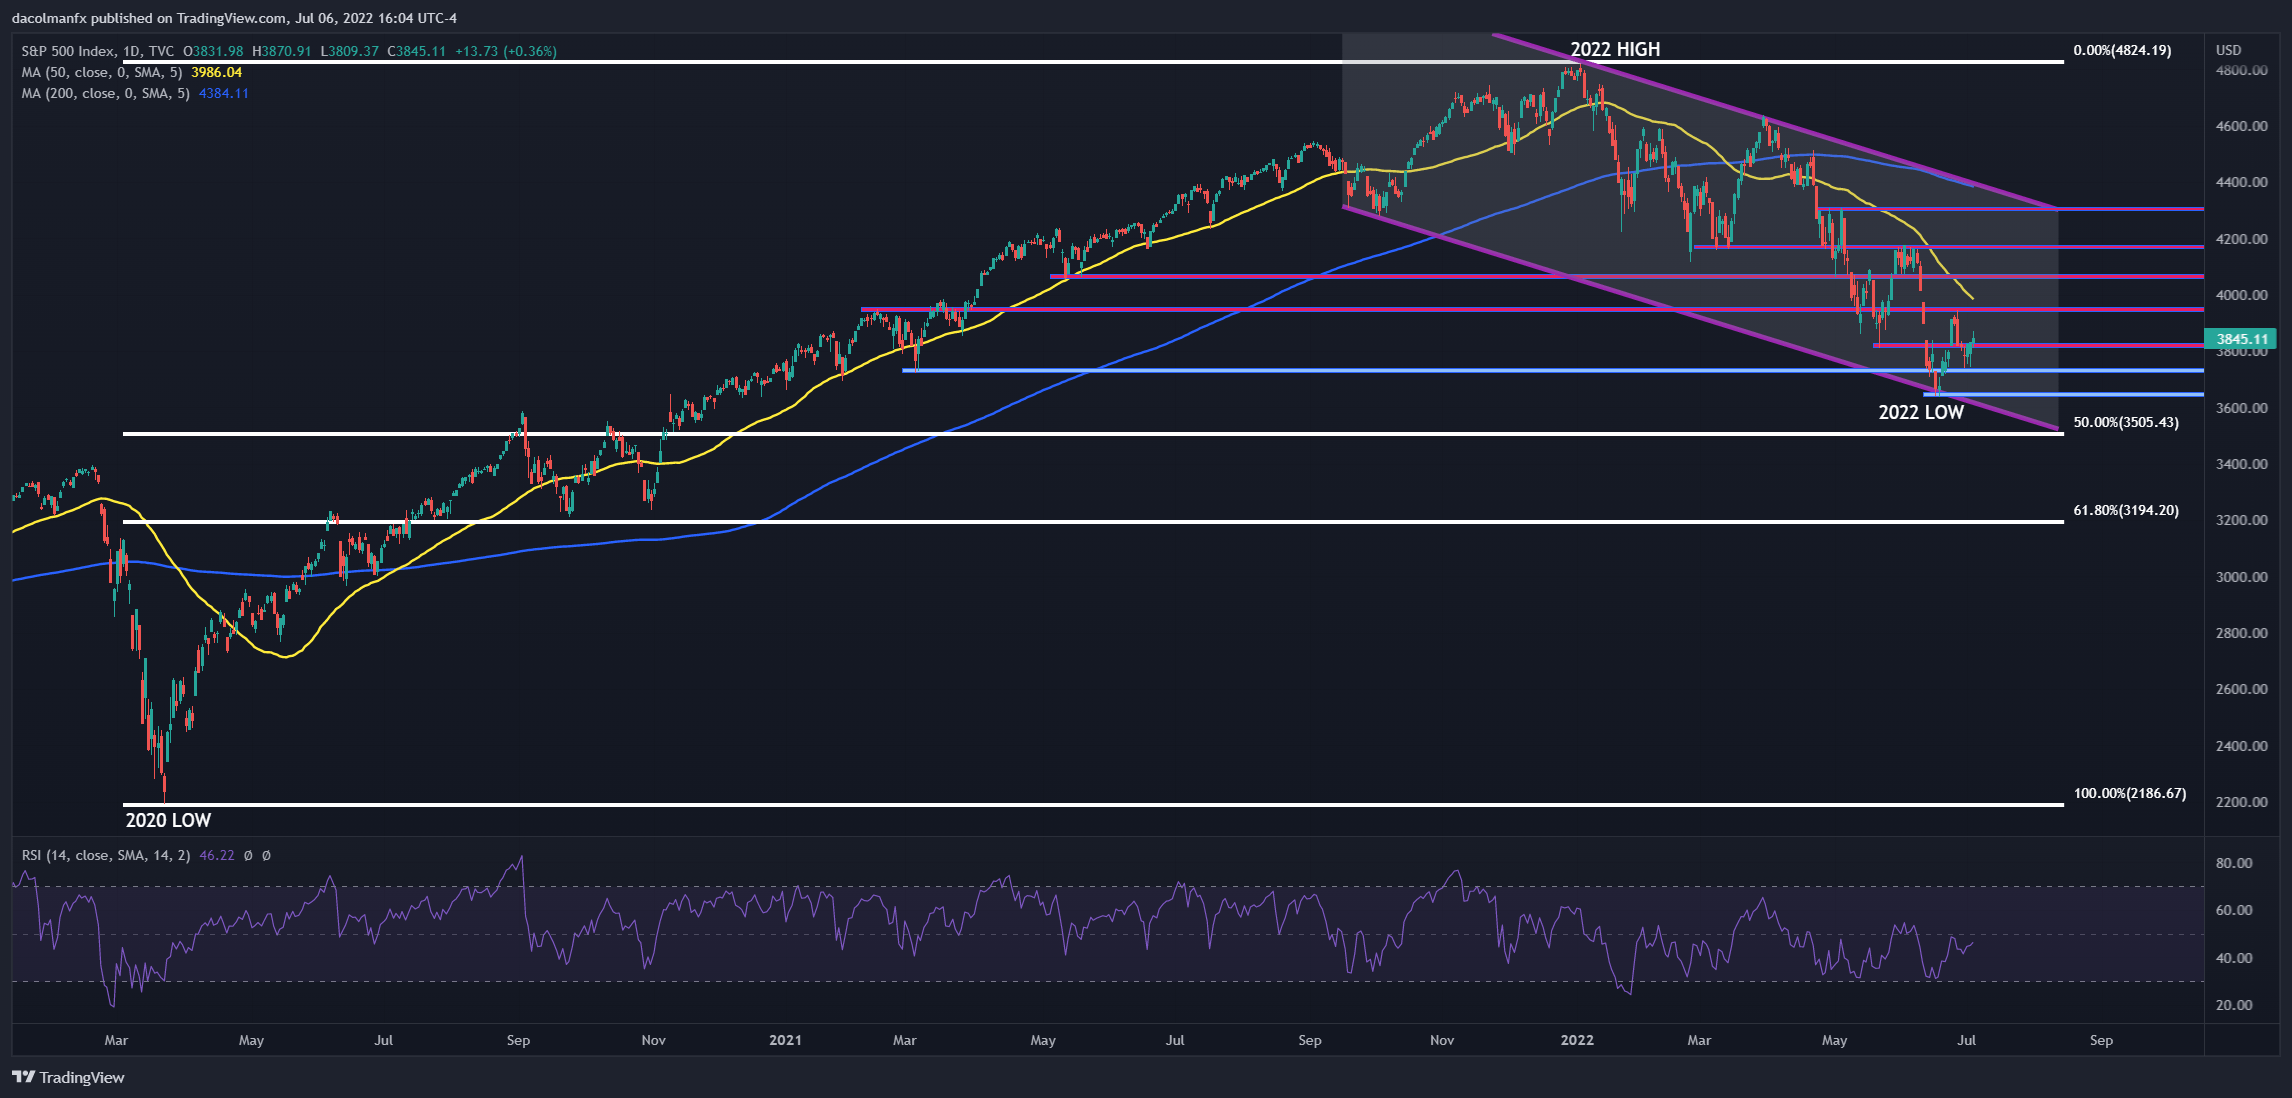
S&P 500 TECHNICAL ANALYSIS
After Wednesday’s advance, the S&P 500 cleared an important resistance near 3,820, coming within a whisker away from exiting bear market territory. If sentiment improves further and prices continue to march higher, the first hurdle to consider appears at 3,950, followed by the 50-day simple moving average. On the flip side, if sellers return and push prices lower, initial support rests at 3,820 and 3,730 thereafter. If the latter floor is violated, bears could launch an attack on the 2022 lows near 3,640.
S&P 500 TECHNICAL CHART