


Crude Oil Price, Chart, and Analysis
For a list of all market-moving data releases and events see the DailyFX Economic Calendar

The wave of US dollar buying on Tuesday caught many market participants unaware and sent a wide range of asset markets to multi-month and multi-year extremes. The incessant USD buying was sparked by heightened fears that the world’s largest economy may be nearing, or is even in, a recession as economic growth slumps. The Federal Reserve’s late to the party response to tackling inflation of hiking interest rates at a record pace and level has slammed the brakes on economic activity. US Q1 GDP contracted at an annualized rate of 1.6% and the closely watched Atlanta Fed’s GDP Now measure shows Q2 US GDP contracting by 2.1%. If this is the case, the US would be in a technical recession.
Crude Oil Latest – Selling Off Into Support as Recession Fears Grow
China remains in the grip of a zero-covid policy with the city of Xi’an the latest victim of a lockdown. The city, home to 13 million, has been shut down for sevendays due to the spread of a virulent version of the Omicron variant.
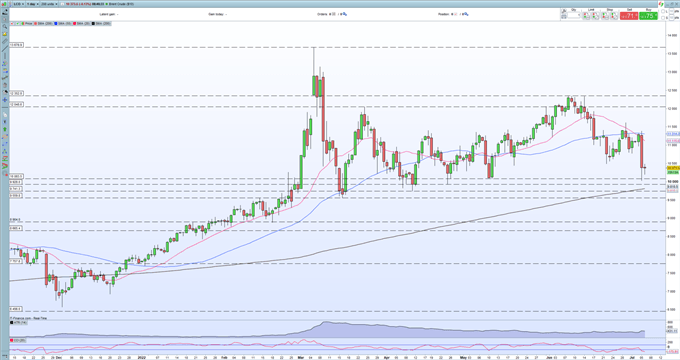
The price of Brent Crude is stable in early turnover after trading in a wild 10% range on Tuesday. After opening near its high for the day, oil sold off sharply later in the session and touched a multi-week low of $100.30/bbl., before making a partial recovery. There is a zone of support between $95.60/bbl. and $100.80/bbl. made up of a cluster of prior swing lows and this area should hold any further short-term sell-off. In the longer-term however, any further signs of global economic weakness could see oil drop below $90/bbl. for the first time since February this year.
Brent Crude Daily Price Chart – July 6, 2022
Trade Smarter - Sign up for the DailyFX Newsletter
Receive timely and compelling market commentary from the DailyFX team
If we look at US Crude Oil, IG retail trade data show 68.48% of traders are net-long with the ratio of traders long to short at 2.17 to 1. The number of traders net-long is 38.60% higher than yesterday and 39.12% higher from last week, while the number of traders net-short is 41.64% lower than yesterday and 44.17% lower from last week.
We typically take a contrarian view to crowd sentiment, and the fact traders are net-long suggests Oil - US Crude prices may continue to fall. Traders are further net-long than yesterday and last week, and the combination of current sentiment and recent changes gives us a stronger Oil - US Crude-bearish contrarian trading bias.
| Change in | Longs | Shorts | OI |
| Daily | 2% | -3% | 1% |
| Weekly | 36% | -27% | 18% |
What is your view on Crude Oil – bullish or bearish?? You can let us know via the form at the end of this piece or you can contact the author via Twitter @nickcawley1.


