


S&P 500, Nasdaq, FX Talking Points:
- This webinar took a tops down look at FX and equities as we get Q3 underway.
- The US Dollar got a fast start to the quarter, breaking out to a fresh 19-year high. Stocks, on the other hand, may have some deeper pullback potential ahead of the start of earnings season, which I’m anticipating to be the next bearish driver.
- The analysis contained in article relies on price action and chart formations. To learn more about price action or chart patterns, check out our DailyFX Education section.

This was my first webinar for Q3 and given the environment, it seemed a good time to take a step back to look at themes in a tops-down manner.
There are a number of major market themes that remain in the spotlight. Stocks had a rough first-half of the year, historically so by some standards, and the door appears to be open for more as we move into Q3. I set this as my Top Trade again for the quarter but, unlikely last quarter, I don’t have such benefit of timing.

Last quarter saw a two-week ramp after the FOMC rate decision that helped to push stocks back up to resistance. But, this quarter, stocks have kind of limped into the period and there’s not much attractive resistance potential to sell-off of just yet. So, we may be looking at some short-term pullbacks in equities and I’ve spotted a possible formation for such in the Nasdaq that I look at below.
On the FX side of the equation, however, the quarter has gotten off to a fast start as the US Dollar has already broken-out to a fresh 19-year high. I had looked at that theme earlier today in the US Dollar Price Action Setups article, and since then prices have engaged with another new spot of resistance at 106.61, which is the 38.2% retracement of the 1985-2008 major move.
US Dollar Monthly Price Chart
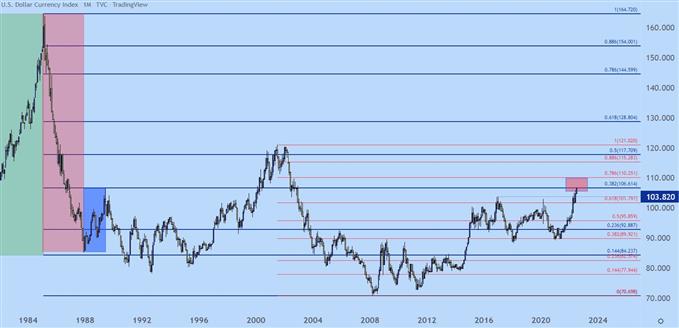
Chart prepared by James Stanley; USD, DXY on Tradingview
The big question on the FX front for Q3 is the Euro.
Friday brought another inflation print out of the Euro-zone that was above 8%. The ECB, at this point, seem pretty casual about the matter, pledging only to a 25 basis point hike in July. That probably won’t get the job done and it’s become clear that the ECB isn’t more motivated by the matter, the bottom has been falling out of EUR/USD.
This morning brought a fresh 19-year-low to go along with that fresh high in the USD. And if the ECB doesn’t change their tune, we could soon see the parity level in EUR/USD come into play.
But, perhaps more importantly than just an FX movement, that could also entail a much darker economic forecast for the European bloc, as a falling Euro could only expose the continent to even more inflation, which will also be driven by ongoing tension between Ukraine and Russia, and Europe is in a truly negative and threatening scenario.
This is something that would be unlikely to miss the U.S. as such a close trading partner, particularly if breakaway inflation brings on a collapse-like scenario in European financial markets.

EUR/USD Monthly Price Chart
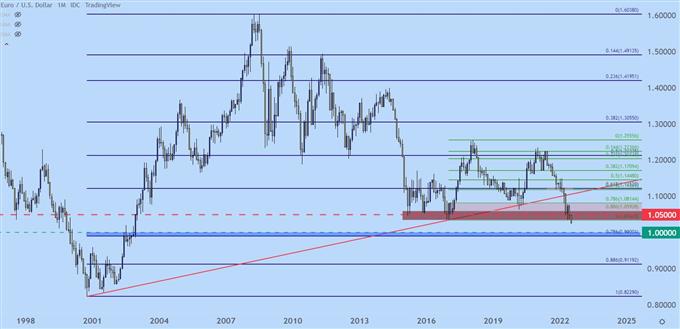
Chart prepared by James Stanley; EURUSD on Tradingview
GBP/USD
I looked at this on a very short-term basis in the webinar, essentially plotting pullback scenarios to look for where lower-high resistance might start to play-in.
The zone from 1.2000-1.2021 is an obvious area for such an approach, and short-term resistance at 1.1968 opens the door for a move up to that 1.2000 psychological level.

GBP/USD Two-Hour Price Chart
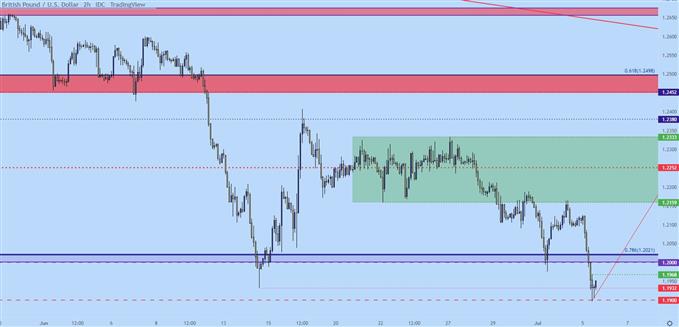
Chart prepared by James Stanley; GBPUSD on Tradingview
USD/JPY
USD/JPY has held the bullish trend through the Q3 open. Question remain on the bank’s ability to keep up their strategy in the JGB market but, at this point, there’s been no signs yet of the BoJ shifting.
USD/JPY has continued to hold support in the same 134.48-135.00 area, and as looked at during the webinar, there was even a shorter-term spot that was coming into play.
Notably, retail is still trying to call a top with roughly three traders short for every one that’s long in our IGCS study. To learn more about IGCS Sentiment:

USD/JPY Four-Hour Price Chart
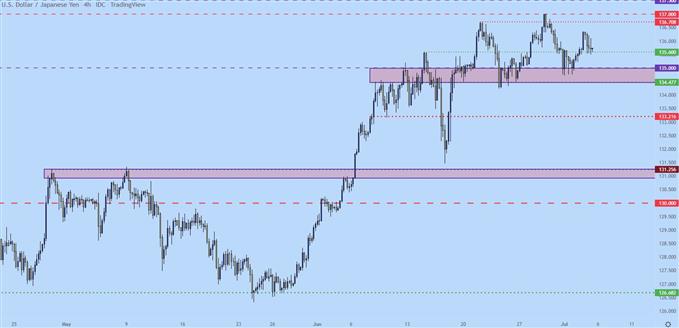
Chart prepared by James Stanley; USDJPY on Tradingview
Equities
As mentioned earlier, I set the bearish side of US equities as my Top Trade for Q3. This is the second consecutive quarter for that and Q1 I focused in on the long side of the USD; which really feels like a related theme to me at this point.
Equities can be tough at this point given how far they’ve already sold off. There’s quite a bit of pessimism priced-in but after some of the dynamics from last week, as there were short-term rallies on the back of ‘hope’ that rate hikes would calm shows that there’s still some significant ‘buy the dip’ mentality in markets that hasn’t really been run over yet.
And if we take something like the Nasdaq, which has already fallen by a third since last November’s high, and it can be difficult to substantiate a bearish argument until something negative happens. I think earnings season could bring that pain for stocks in Q3. We’ll start getting into earnings in a couple of weeks; so I’m expecting this theme to be in the picture by the end of July which could bring another bearish driver.
At this point, we haven’t even really seen a full earnings season where higher rates and a hawkish Fed were a given, nor have we seen the impact of the Fed’s shift on earnings reports just yet. That will happen during Q3 and I think this is another risk for stocks in the near-term.
In the Nasdaq 100, there is a possible pullback as shown by a falling wedge formation. Resistance for that formation shows around 11,964, so bulls will need to push to even trigger the formation, but if that comes into play, a move up towards 12,175 cannot be ruled out. Additional resistance can be sought at around 12,585 and then a major zone comes into play around the 12,894-13,050 area, and a break above that would bring the bearish trend into question.
Nasdaq 100 Daily Chart
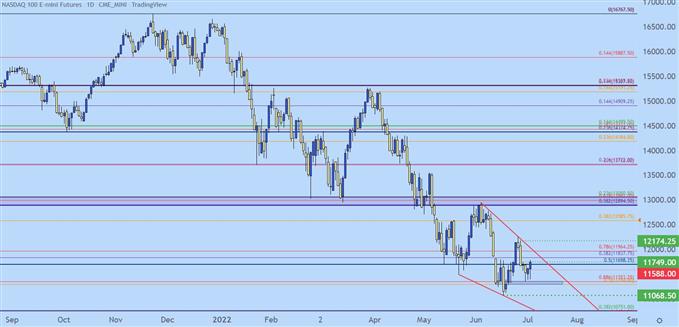
Chart prepared by James Stanley; Nasdaq 100 on Tradingview
Taking a step back keeps the bearish theme very much alive. The point of resistance at 11,700 is a key one as this is the 50% mark of the pandemic move. But, even if that falling wedge does fill in, provided that prices remain below the 12,897-13,050 zone, there’s going to be a bearish allure to this chart.
So, the bigger question on the bearish side really appears to be timing: The index put in a really large move in the first-half of the year and the primary driver behind that move remains in-play, leading to no evidence yet of a low being in-play.
Nasdaq 100 Weekly Price Chart
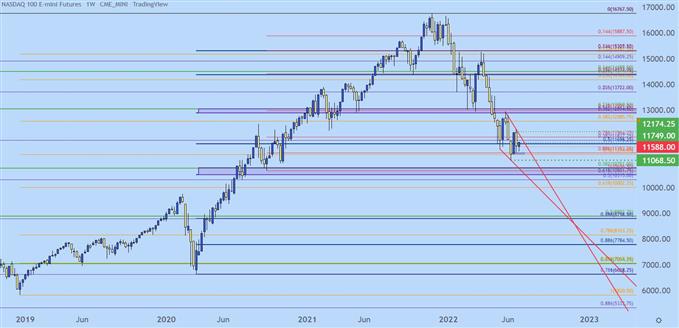
Chart prepared by James Stanley; Nasdaq 100 on Tradingview
S&P 500
The S&P 500 is still finding short-term resistance at the familiar zone around the 3800 level. This zone contains three different Fibonacci retracement levels at 3802, 3813 and 3830. That zone came into play as support in May before showing as resistance in early-June. At this point, it’s back in as resistance but like I mentioned above in the Nasdaq, prices still have a somewhat oversold feel that could allow for pullback, particularly as the door has opened into a new quarter.
At this point, support is holding at the 3660 Fibonacci level and there’s resistance potential up to around the 4k psychological level.
The next major support zone on my chart is around the 3500 level (in green below) which is followed by the zone around 3200. That latter zone would be something that I’d look to come into play in Q4 unless matters get especially busy in Q3, which may mean that a low is finally in-sight.
S&P 500 Weekly Price Chart
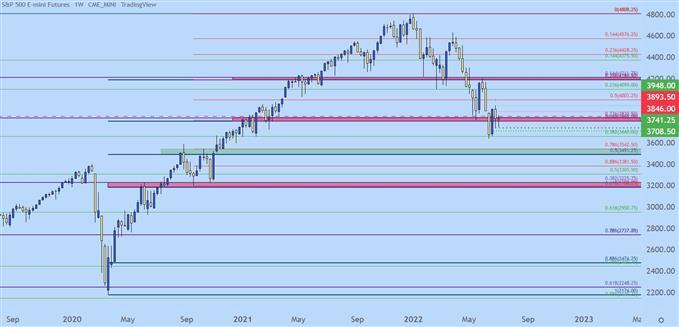
Chart prepared by James Stanley; S&P 500 on Tradingview
--- Written by James Stanley, Senior Strategist for DailyFX.com
Contact and follow James on Twitter: @JStanleyFX


