


Euro Talking Points:
- Last Friday saw Euro-zone inflation print at 8.6% v/s 8.4% expected with core coming in at 3.7% v/s a 3.9% expectation.
- At this stage, rate hike expectations around the ECB remain very low and that’s allowed for the currency to fall through the floor against the US Dollar. This seems very similar to the same scenario around the FOMC last year, as the bank kept rates low even as inflation flared, hoping that higher prices would just take care of itself. Instead, currency weakness adds fuel to the fire and there’s little attraction in holding long Euros at this point.
- The analysis contained in article relies on price action and chart formations. To learn more about price action or chart patterns, check out our DailyFX Education section.

The Euro has started Q3 with a troubling move as the single currency has seemingly been unable to catch a bid. Yesterday saw EUR/USD push down to a fresh 19-year-low, and Euro weakness is showing as a pervasive theme with EUR/JPY and EUR/CHF putting in similar notes of bearish behavior.
The root of the problem seems to be fundamental, which is starting to create a technical issue. The ECB is rightfully afraid of recessionary pressures, a risk that’s only grown after the Russian incursion of Ukraine. That situation has helped to push prices higher already and with tensions holding firm, there’s even more upside risk to inflation. The European Central Bank seems fearful of rate hikes, trying to avoid choking off what growth they do have left. But, as the US found in the 70’s and then again last year, just ignoring inflation isn’t necessarily a great strategy either as it could only create more and more inflationary pressure if left unaddressed.
Given this avoidance of policy tightening as many other major economies lift rates, this makes the Euro an unattractive currency to be holding and that’s helped EUR/USD to fall through the floor to start Q3. On the below monthly chart, we’re seeing those fresh 19-year lows that printed again earlier this morning.
EUR/USD Monthly Price Chart
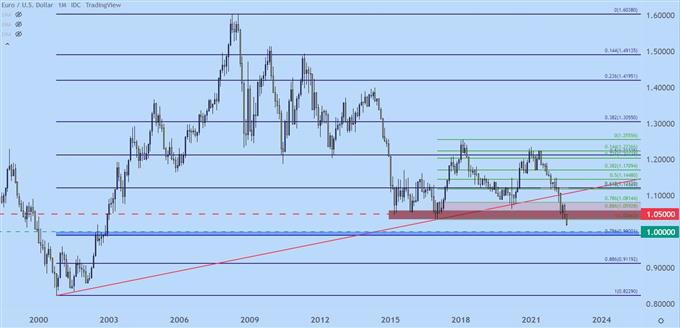
Chart prepared by James Stanley; EURUSD on Tradingview
EUR/USD Parity Possible?
Expect to see this in the headlines over the coming days or even weeks, but with this support break in EUR/USD, the big question is whether EUR/USD can test through the vaulted parity figure. The pair hasn’t traded at that level since 2002 and it does seem more symbolic than anything; but parity is somewhat of the ultimate psychological level. Case-in-point, the EUR/CHF setup that we’ll look at in a moment.
That parity figure can extend down to a Fibonacci level at .9900 to create a 100-pip zone to track for follow-through support. If there’s no stall or bounce or inflection at that point, it might be time to start getting worried about the single currency and the ECB policy surrounding the world’s largest economy.
For resistance potential, that prior zone of support around the 1.0340 handle remains as a point-of-interest.
EUR/USD Daily Price Chart
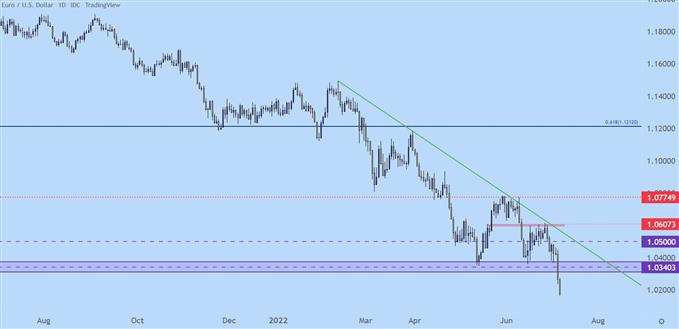
Chart prepared by James Stanley; EURUSD on Tradingview
EUR/JPY
Both the Euro and Yen have a fairly decent argument for weakness, with each backed by negative rates from a Central Bank that’s been in uber-accommodation mode for the past six years.
The difference here, of course, is the inflation. Japan’s most recent inflation report came in at 2.1%, much of which was driven by energy. In Europe, headline inflation was at 8.6% but core was at 3.7%, so still well-elevated from the bank’s 2% target and, even if they are ignoring headline inflation to focus squarely on core, the possibility of significantly higher energy prices given the ongoing battle in Ukraine must be accounted for by European policy makers.
At this point, however, the ECB hasn’t really instilled any confidence that they’re going to put up a significant fight against inflation. And that’s created a counter-trend move in EUR/JPY.
Given how built-in that trend of EUR/JPY strength was as Yen-weakness was all the rage, there could be continued bearish potential and from the daily chart below, we can see a rising wedge formation that’s just started to fill-in with a bearish break. Rising wedges are often followed with the aim of bearish reversals and this can open the door for a deeper bearish move in the pair.
EUR/JPY Daily Price Chart
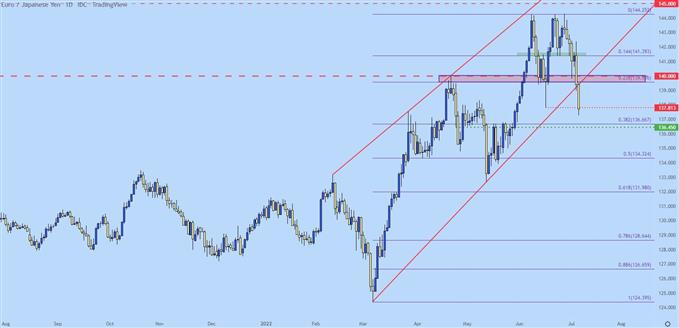
Chart prepared by James Stanley; EURJPY on Tradingview
EUR/JPY Shorter-Term
The pair spilled down to a fresh monthly low earlier this morning, pulling up just shy of the 137.00 level. The next obvious spot of resistance potential is prior support, taken from around the 139.57 zone up to the 140.00 psychological level.
Along the way, price also tested below the neckline of a double top formation, which keeps the door open for a steeper fall in EUR/JPY.
On a much shorter-term basis, if sellers put up a fight at the prior low of 137.81, the door remains open for aggressive short-term bearish trends with focus on next support, taken from around 136.45-136.67.
EUR/JPY Four-Hour Chart
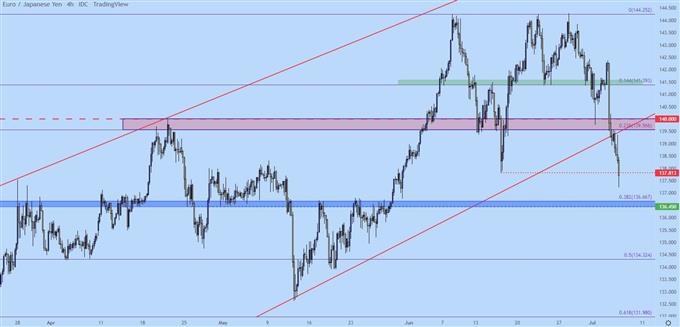
Chart prepared by James Stanley; EURJPY on Tradingview
EUR/CHF: Sign of the Times
EUR/CHF is trading below parity and while that’s not the first time it’s ever happened, it does seem as though it’s the first time that it hasn’t recovered shortly after piercing through parity.
The Swiss National Bank had put in quite a bit of work to defend the peg at 1.2000 from 2011-2015. At the time, falling European credits were driving investors out of the Euro and into the Franc. That became such an outsized theme that the Swiss National Bank feared that high levels of currency strength would bring on deflationary concern or, perhaps even choke off growth, and the bank looked to establish and defend a floor on the currency.
But, floors don’t really work, especially when it’s a smaller economy trying to hold up a larger one and that peg breaking in 2015 had devastating consequences.
Shortly after, another range developed in the pair as the SNB remained somewhat active. The prior peg at 1.2000 came in as resistance in 2018; and since then prices have continued to fall with only a brief pause around the 1.0500 psychological level.
More recently, however, EUR/CHF has fallen below the parity figure and sellers have continued to drive. Again, similar to EUR/USD themes, the driver is rate divergence, with the Swiss National Bank hiking rates while the ECB continues to sit on their hands.
EUR/CHF Monthly Price Chart
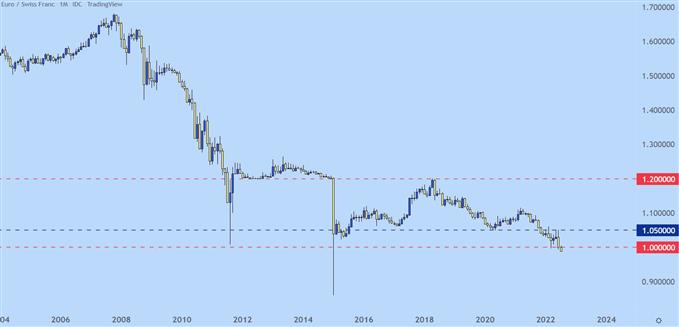
Chart prepared by James Stanley; EURCHF on Tradingview
--- Written by James Stanley, Senior Strategist for DailyFX.com
Contact and follow James on Twitter: @JStanleyFX


