


Japanese Yen Talking Points:
- USD/JPY has set a fresh 24-year high after last week’s pullback found support at prior resistance.
- While Yen-weakness remains, that breakout seems to be very much driven by the USD. EUR/JPY, GBP/JPY and AUD/JPY all remain below key resistance.
- The analysis contained in article relies on price action and chart formations. To learn more about price action or chart patterns, check out our DailyFX Education section.

Japanese Yen weakness has come back and USD/JPY has just set a fresh 24-year high this morning, breaking above the 136.71 level that had stalled the advance a week ago.
I had looked into the matter shortly after that high was set and, as I said then, chasing seemed imprudent and, instead, pullback themes remained attractive. There was also a very operative area of support nearby, as taken from prior resistance. The zone running from 134.48 up to the 135.00 psychological level had stalled the trend for a couple of weeks before buyers were finally able to break-through last week.
Price soon pulled back and found support in this zone on Thursday and Friday of last week, with bulls starting to push again after this week’s open. Now we have a fresh high and the next obvious level-higher on the chart is the 137.50 psychological level.
USD/JPY Daily Price Chart
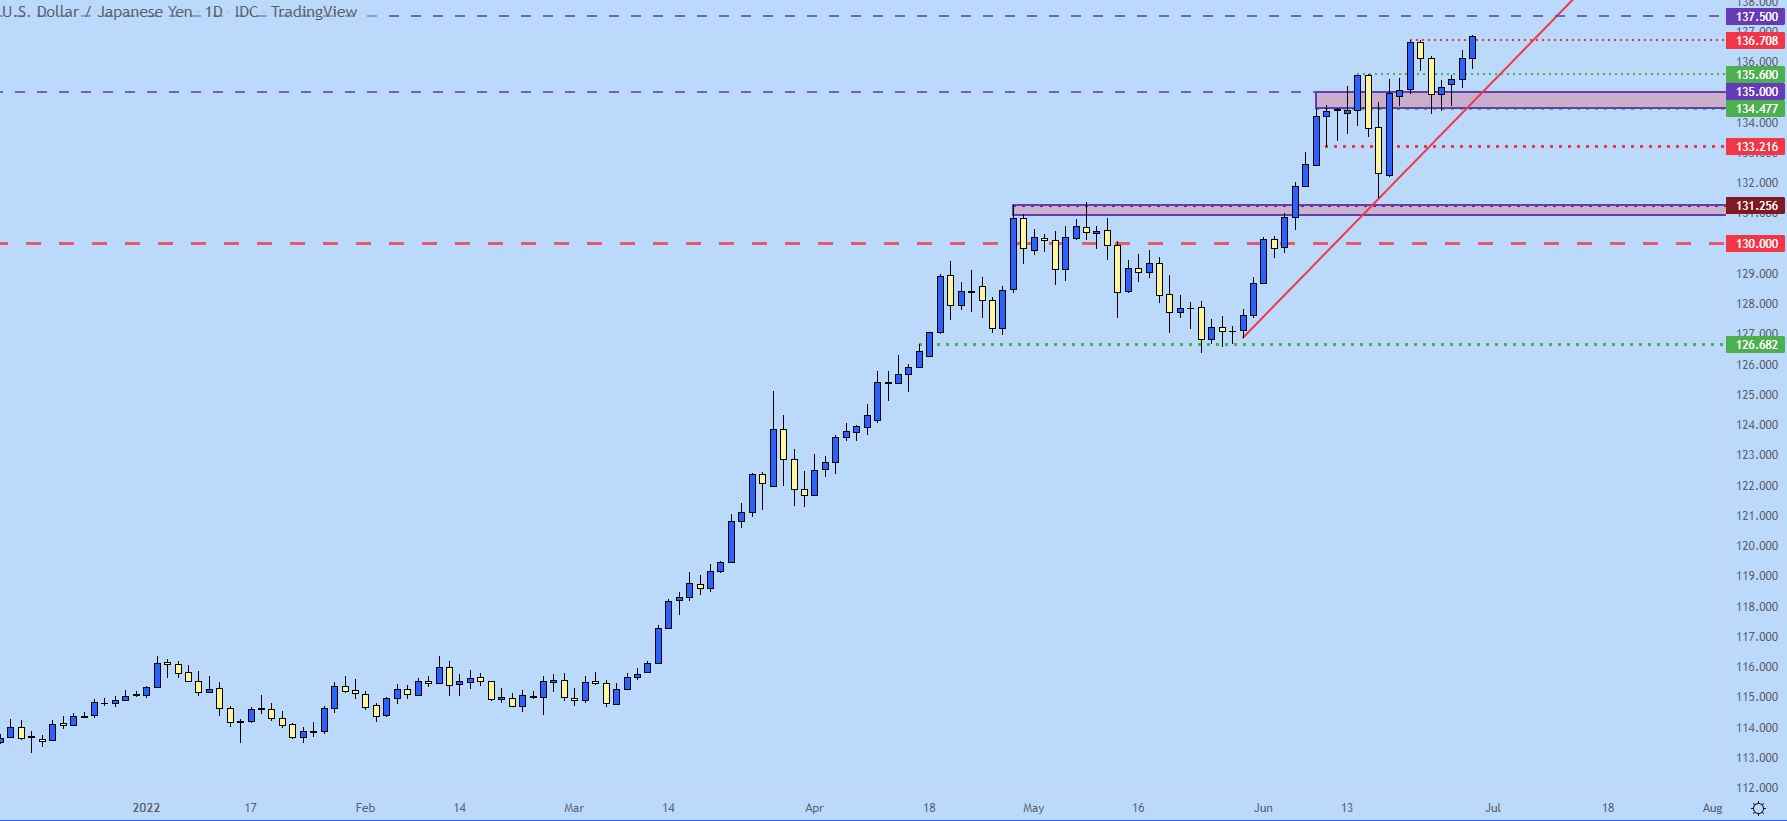
Chart prepared by James Stanley; USD/JPY on Tradingview
EUR/JPY: Triple Top
I had also looked into EUR/JPY last week, highlighting a potential revisit of resistance at a big spot, 144.25, which had set the high earlier in the month. The logic behind the bullish side was that a combo of continued passiveness at the BoJ, combined with an ECB that should be getting more-hawkish could create a strong fundamental drive in the pair.
While Yen-weakness remains, the ECB still seems fairly dovish. This morning brought a softer German inflation figure than expected but that’s at least partially offset by a 10.2% inflation print out of Spain, going against a 9% expectation. And, arguably, the Spanish economy could be more vulnerable to the impacts of inflation than the German economy, which could just spell the need for higher rates in Europe that much more if/when the ECB starts to finally address the matter.
In EUR/JPY, we have a very interesting technical backdrop. Longer-term, there’s a triple top formation. And shorter-term, there’s a double top that’s built after the prior double top. So, I want to take this from a tops-down format.
From the daily chart below, we can visibly see those three resistance tests at the 144.25 level. From this chart, bullish breakout potential remains on a breach of that high watermark. The next obvious level of resistance is the 145.00 psychological level.
EUR/JPY Daily Chart
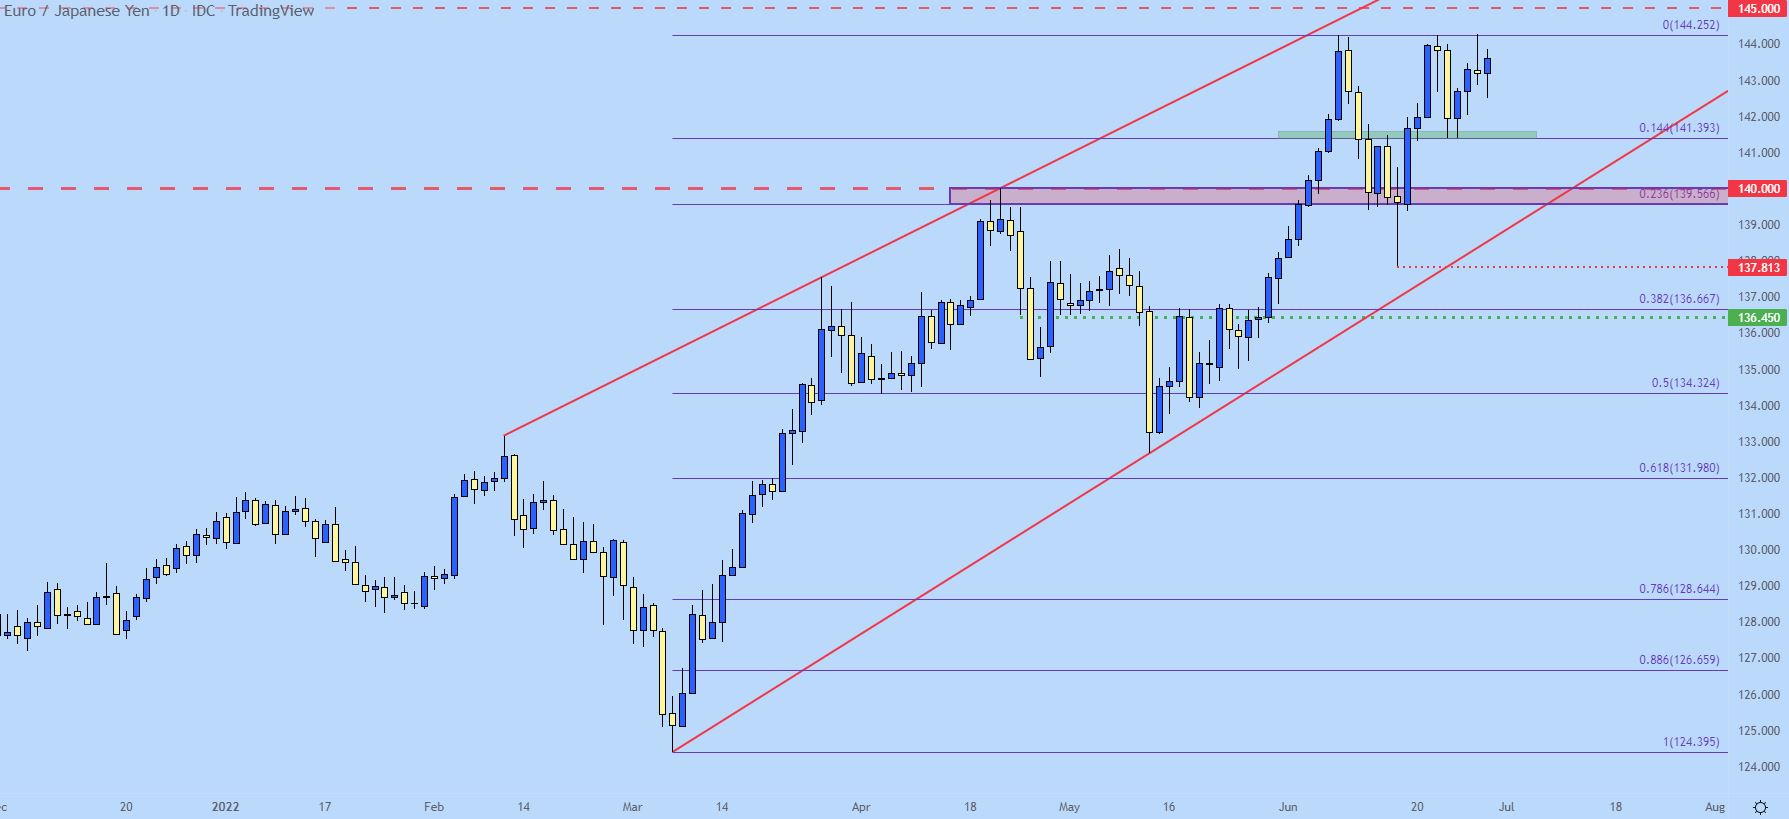
Chart prepared by James Stanley; EUR/JPY on Tradingview
EUR/JPY on a shorter-term basis highlights some reversal potential if bulls are unable to sustain a break beyond resistance.
This week’s support showed up at a Fibonacci retracement plotted at 141.39 and that level can function as an initial neckline for the triple top formation. A breach of that support then opens the door for a move down towards a bigger spot of support, taken from the 139.57-140.00 zone.
And at 137.81 we have the neckline from the initial double top formation and this has some longer-term, bigger-picture connotations. For that level to come into play anytime soon, we’ll likely be seeing some massive change in the backdrop, but a break of that would be a very bearish item for the pair.
EUR/JPY Four-Hour Price Chart
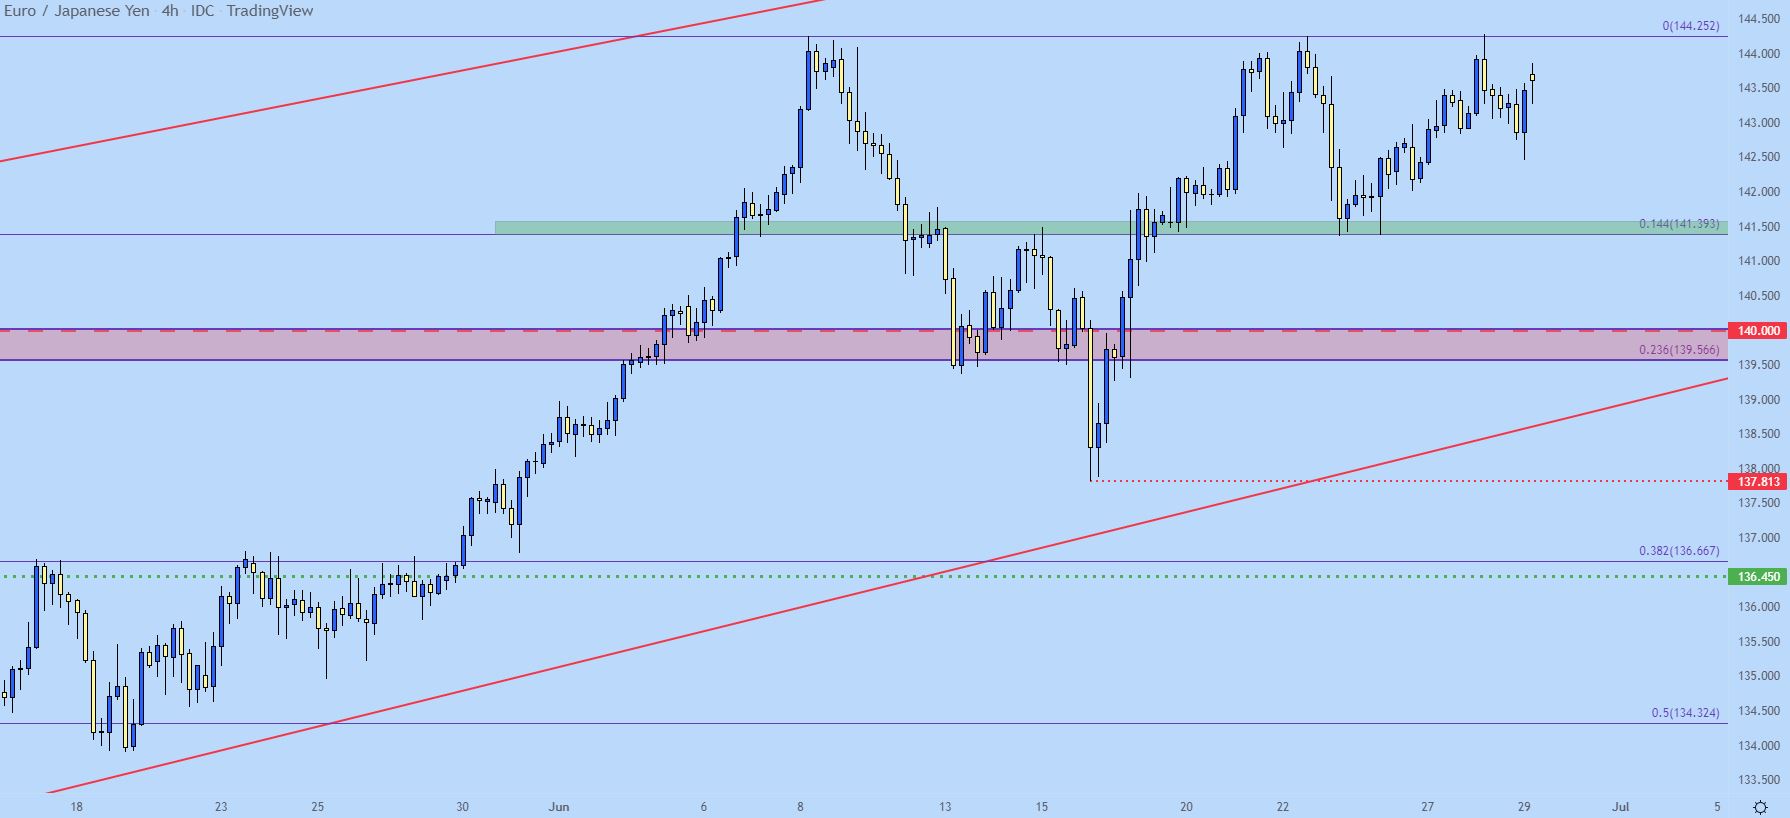
Chart prepared by James Stanley; EUR/JPY on Tradingview
GBP/JPY
There’s a similar long-term item of interest here. Current resistance is holding around the 61.8% Fibonacci retracement of the 2015-2016 major move in the pair and that level has already seen a couple of tests. It helped to hold the highs in April and then again in early-June. That prices is at 168.06 and hasn’t been in-play since than failed breakout earlier this month.
GBP/JPY Weekly Price Chart
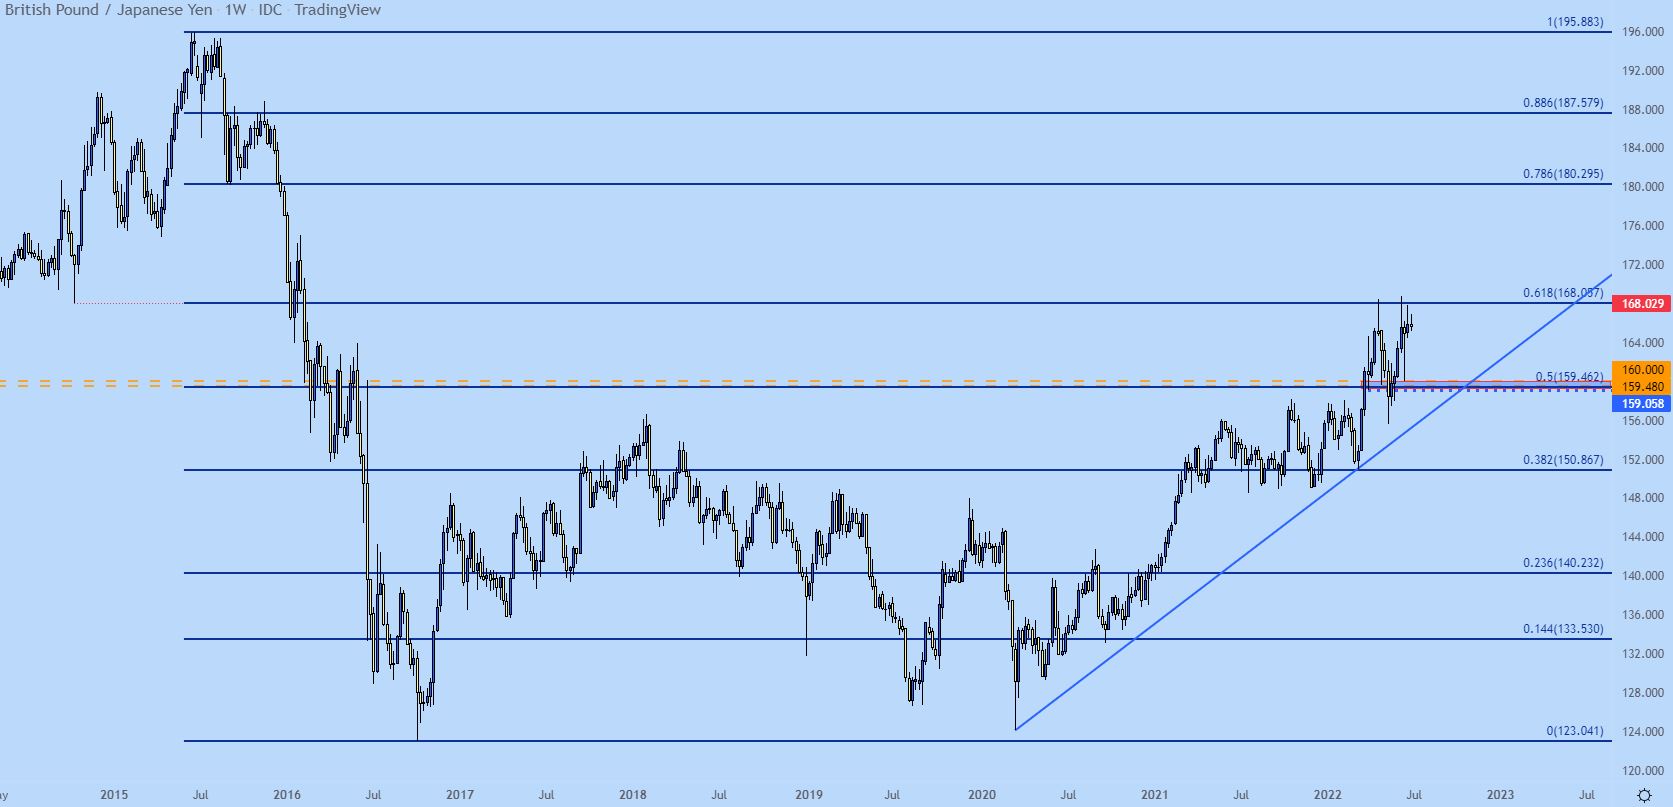
Chart prepared by James Stanley; GBP/JPY on Tradingview
GBP/JPY on a shorter-term basis is less clear, with price showing mean reversion over the past week. There has been a series of lower-highs to go along with horizontal support around the 165.00 level. This can keep the door open for deeper pullback potential in the pair until that bearish trendline is taken-out.
GBP/JPY Four-Hour Price Chart
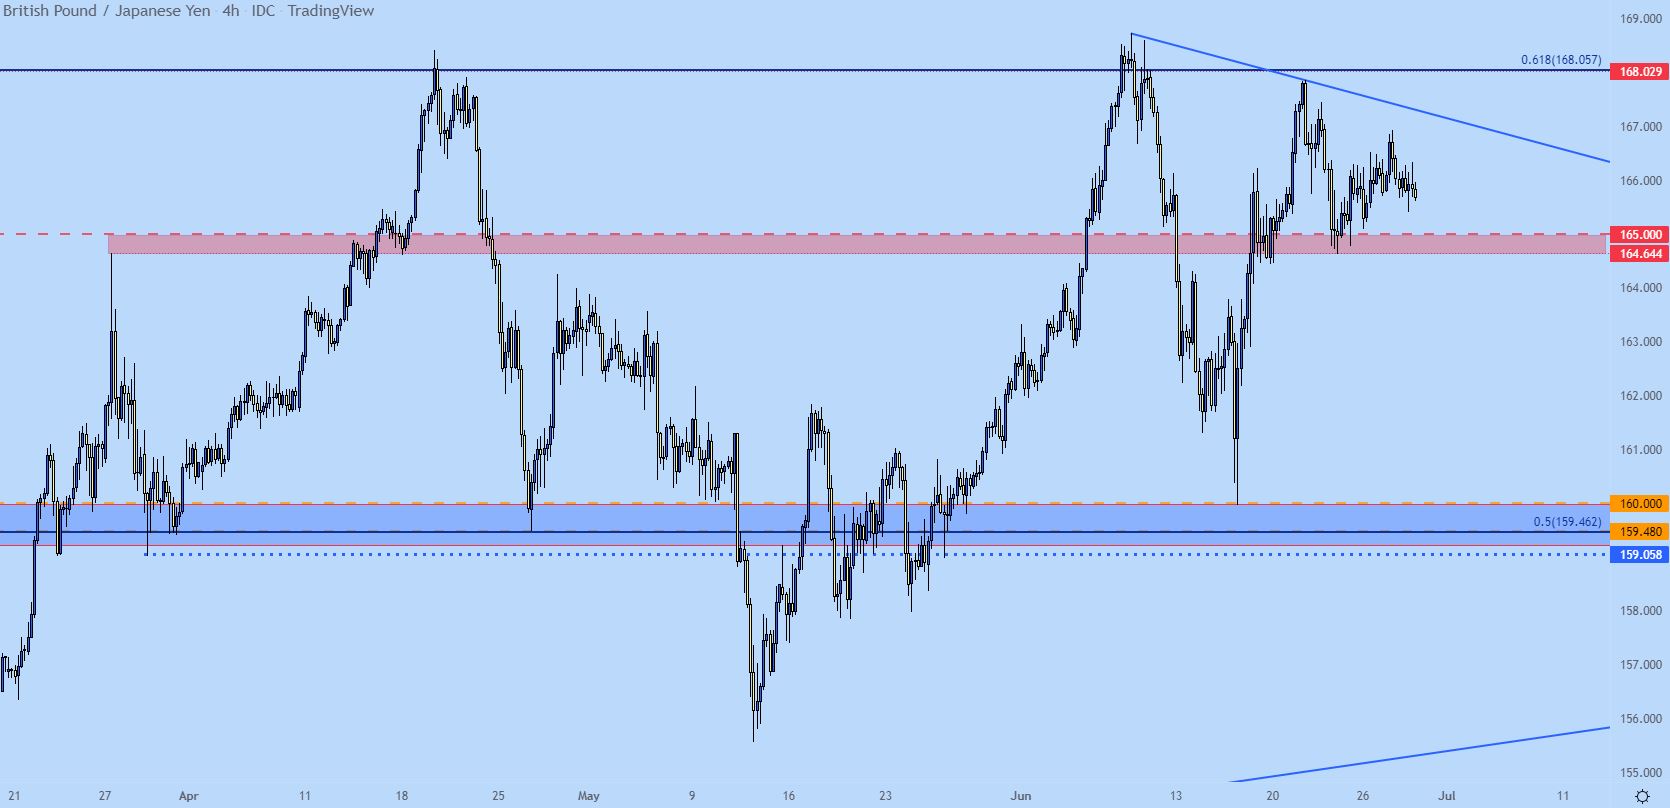
Chart prepared by James Stanley; GBP/JPY on Tradingview
AUD/JPY
AUD/JPY is another market that has yet to test through those early-month highs. The 95.00 psychological level is key here as there hasn’t yet been a weekly close above that level, despite the fact that bulls broke fresh ground on the second failed test.
AUD/JPY Weekly Chart
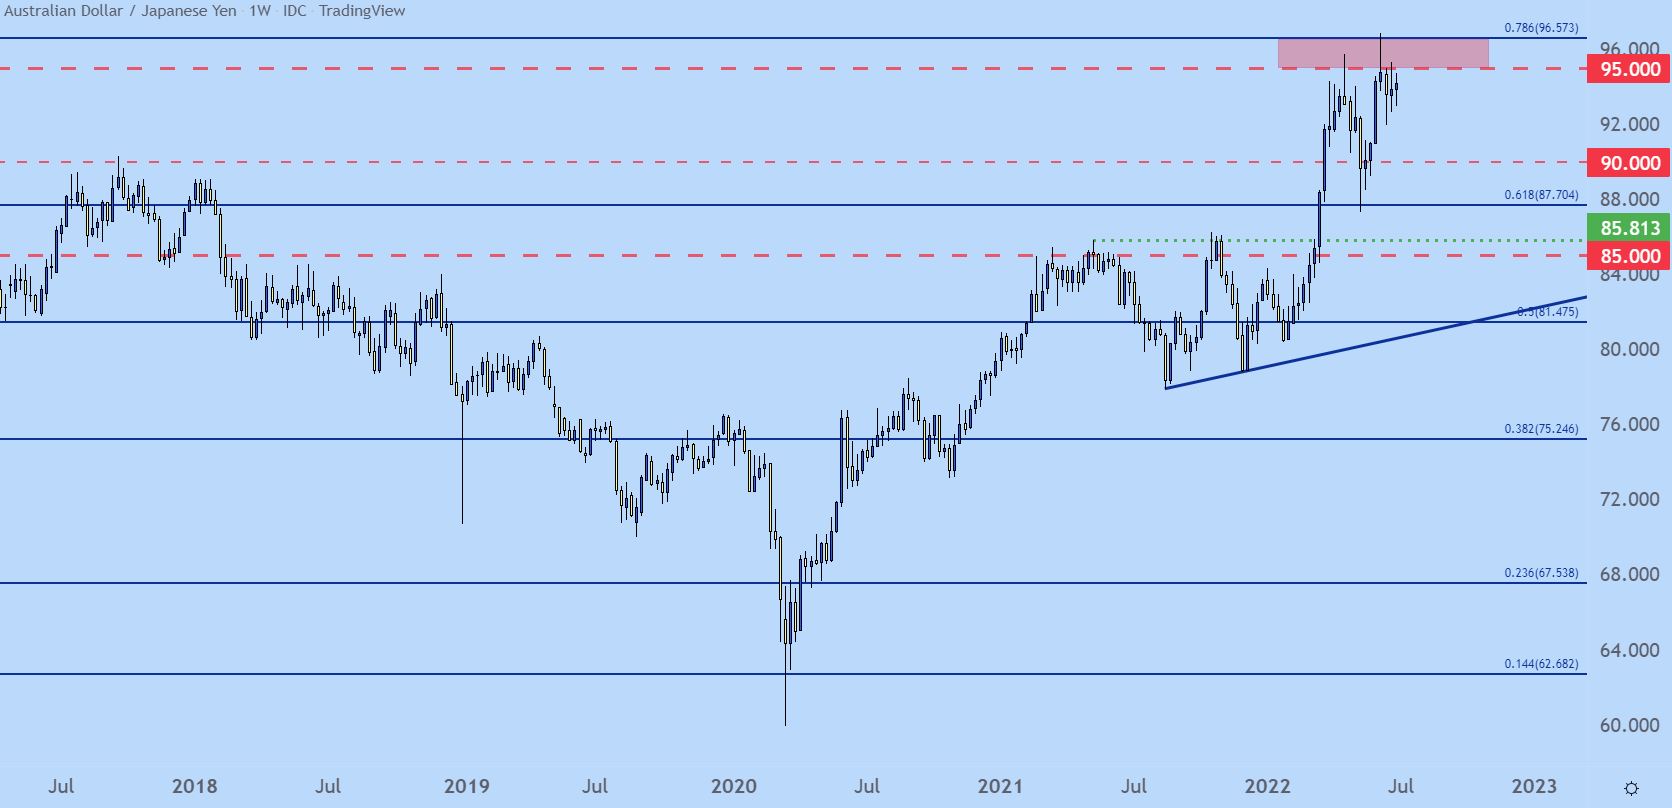
Chart prepared by James Stanley; AUD/JPY on Tradingview
On a shorter-term basis, we have a symmetrical triangle, which when taken with the prior bullish move makes for a bull pennant formation. This keeps the focus on bullish potential with the possibility of breakout at the 95.00 level.
AUD/JPY Four-Hour Chart
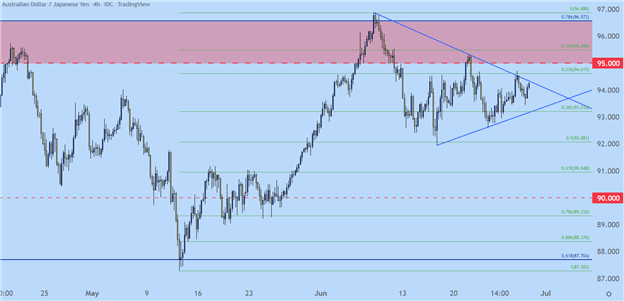
Chart prepared by James Stanley; AUD/JPY on Tradingview
--- Written by James Stanley, Senior Strategist for DailyFX.com
Contact and follow James on Twitter: @JStanleyFX


