


Japanese Yen Talking Points:
- I looked at the Yen last Friday following the Bank of Japan rate decision.
- At that meeting, the BoJ seemingly kept the door open for Yen-weakness and already traders have pounced on that theme, pushing USD/JPY up to fresh 24-year highs.
- With shifts towards more-hawkish policy also showing in Europe, the UK and Australia, there’s potential for continued deviation between Euro, GBP and AUD currencies against the JPY, keeping the door open for trend continuation scenarios.
- The analysis contained in article relies on price action and chart formations. To learn more about price action or chart patterns, check out our DailyFX Education section.

The Japanese Yen has continued its sell-off following last week’s Bank of Japan rate decision.
With much of the developed world turning towards more-hawkish policy, the expectation had begun to build for Japan to do the same. But, as we heard last Thursday night, the BoJ wasn’t yet ready to remove the massive accommodation that’s been in-place in Japan since 2016 and, seemingly, this kept the door open to another run of Yen-weakness.
I had looked into the matter on Friday just after that rate decision, highlighting the potential for breakouts in USD/JPY among a number of other Yen-pairs. Since then, USD/JPY has shot up to yet another fresh high, this time a 24-year-high while breaching the 135.00 psychological level that had stymied the advance earlier in June.
USD/JPY Monthly Chart: Fresh 24-Year-Highs

Chart prepared by James Stanley; USD/JPY on Tradingview
USD/JPY: What’s Next
The topside trend remains attractive here but timing is of a concern, as the pair has just launched up to a new fresh high water mark. Chasing seems imprudent and given the build of resistance at the 135.00 area, this presents some support potential for pullback themes.
But, for those that remain very aggressive, price may not scale all the way back to 135.00 as current price is more than 120 pips away. Instead, a more nearby level could be used at that 135.60 prior swing-high. This could be looked at as a type of ‘s1’ with the 135.00 level functioning as an ‘s2’ spot of support.
USD/JPY Four-Hour Chart

Chart prepared by James Stanley; USD/JPY on Tradingview
EUR/JPY
Given the events of the past couple weeks, EUR/JPY became attractive on the long side last week. The ECB started to shift towards more-hawkish policy, albeit in a very slow and tepid manner. The Bank of Japan, at this point, haven’t even started that shift. In Europe, inflation is over 8% and in Japan, it just crossed over 2%. So, likely, we’ll see more pressure on the ECB to pick up inflation-fighting efforts while Japan may have a bit more slack to work with on the matter.
As looked at last Friday, this hawkish shift at the ECB combined with continued dovishness at the BoJ – combined with a morning star on the daily chart of EUR/JPY – opened the door for breakout potential in EUR/JPY with eyes on a re-test of the seven-year high at 144.25.
EUR/JPY Daily Chart
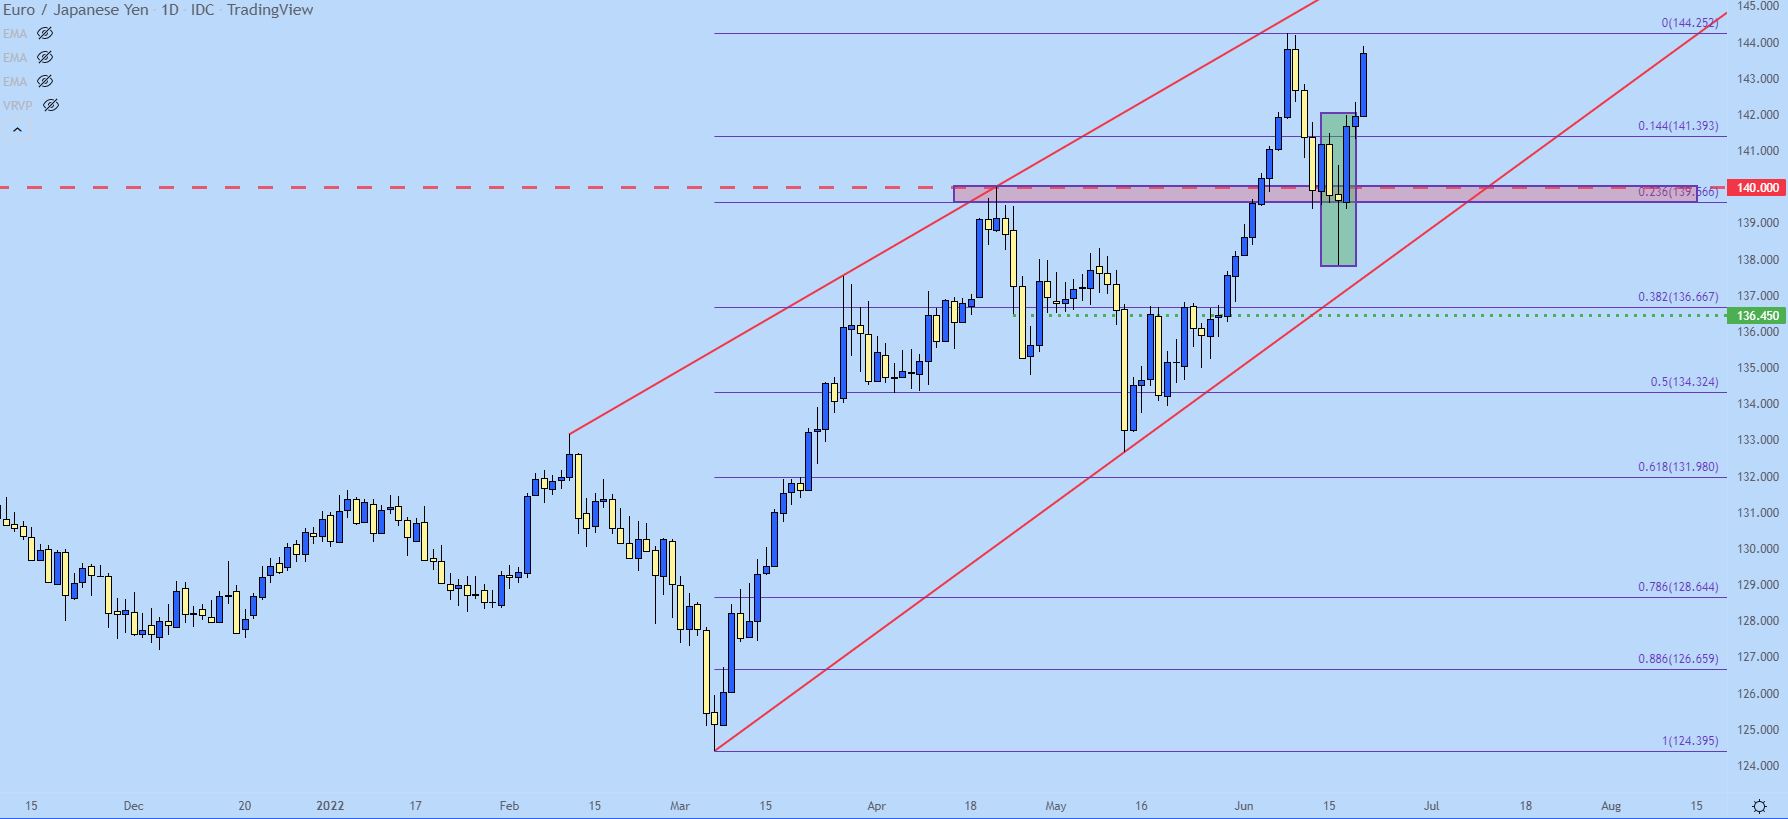
Chart prepared by James Stanley; EUR/JPY on Tradingview
That high watermark hasn’t yet been hit but price is making a fast advance towards this area, and taking a shorter-term look at the chart, there may be more breakout potential beyond that price.
On the below chart we can see price action brewing into an inverse head and shoulders formation, which keeps the door open for bullish breakout potential beyond the high at 144.25.
EUR/JPY Four-Hour Chart

Chart prepared by James Stanley; EUR/JPY on Tradingview
GBP/JPY
GBP/JPY is approaching a massive spot of resistance.
This spot around at 168.05 is the 61.8% Fibonacci retracement of the 2015-2016 major move. This level caught the high in April and then again two weeks ago and, at this stage, it’s setting the six-year-high in the pair.
GBP/JPY Monthly Price Chart

Chart prepared by James Stanley; GBP/JPY on Tradingview
The big spot of support in the pair played in right off of the 160.00 just last week. That support inflection led to a trampoline-like bounce this still hasn’t slowed yet, and it looks like price is moving headstrong towards a revisit of that prior high.
In a general sense, a revisit of that resistance is attractive for continued breakouts. But, given the pace of the trend, the pair has added more than 700 pips in less than a week and if price is to re-approach that resistance, the run will be at over 800 pips. So, breakout potential does remain but so does the possibility of a pullback when that resistance comes into play, after which topside themes can become attractive for trend-following strategies.
GBP/JPY Four-Hour Chart

Chart prepared by James Stanley; GBP/JPY on Tradingview
AUD/JPY
AUD/JPY has seen similar strength and the pair is currently testing the 95.00 psychological level as resistance. Above that, at 96.57, is a Fibonacci retracement from a longer-term move that’s currently helping to set the seven-year-high in the pair. A breach of 95.00 opens the door for a re-test of Fibonacci resistance about 150 pips higher, after which price would be trading at a pretty open area on the chart, as seen on the monthly below.
AUD/JPY Monthly Price Chart

Chart prepared by James Stanley; AUD/JPY on Tradingview
On a shorter-term basis, we can see the 61.8% retracement from that same major move giving support in early-May, leading to a strong turn-around with price quickly jumping up to the 78.6% marker. But, now after a pullback, 95 resistance is holding the highs as continuation potential brews.
AUD/JPY Daily Chart

Chart prepared by James Stanley; AUD/JPY on Tradingview
--- Written by James Stanley, Senior Strategist for DailyFX.com
Contact and follow James on Twitter: @JStanleyFX


