


US Dollar Talking Points:
- The US Dollar has jumped to a fresh 19-year-high, helped along by a plunging EUR/USD was has set its own 19-year low.
- This move of USD-strength to start the holiday-shortened week is broad-based, with USD strength showing prominently against the Pound, Aussie and Yen.
- The analysis contained in article relies on price action and chart formations. To learn more about price action or chart patterns, check out our DailyFX Education section.
- Quarterly forecasts have just been released from DailyFX and I wrote the technical portion of the US Dollar forecast. To get the full write-up, click on the link below.

The US Dollar is starting Q3 the way that it’s traded for most of the first-half of the year, showing strength as both fundamentals and techs continue to favor the USD. The currency now sits at a fresh 19-year-high, coming very close to the Fibonacci level at 106.61. As I had looked at on the final day of Q2, EUR/USD was going to be a big driver behind the US Dollar this quarter as the Euro had continued to push down for support tests at the 1.0340 area, giving appearance of breakdown potential that’s already come to fruition just a couple days into Q3 trade.
US Dollar Monthly Price Chart
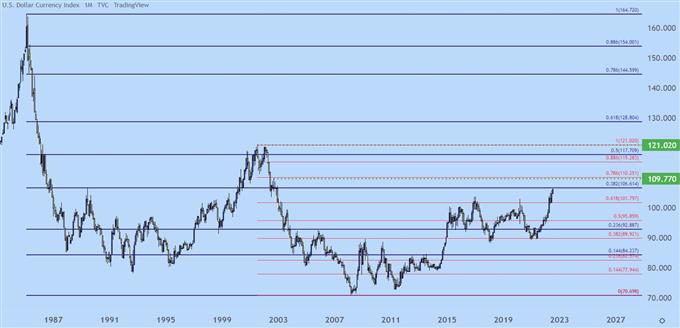
Chart prepared by James Stanley; USD, DXY on Tradingview
US Dollar Shorter-Term
I looked into this theme last Tuesday, highlighting a key support test in the USD as last quarter was winding down. That support at 103.82 was a prior high from 2017 and last week, this served as a launching pad for that move of USD strength.
At this point, the challenge on the long side is trying to avoid chasing the move. And given that this high watermark in the USD comes along with a low watermark in EUR/USD, there could be a propensity for traders to try to fade on or both moves.
The bigger question is how the USD performs on a test of higher-low support. The prior high at 105.79 is now support potential, and there’s some deeper possible support should a pullback lengthen, with possible inflection points at 105.52 and then 104.62.
US Dollar Four-Hour Price Chart
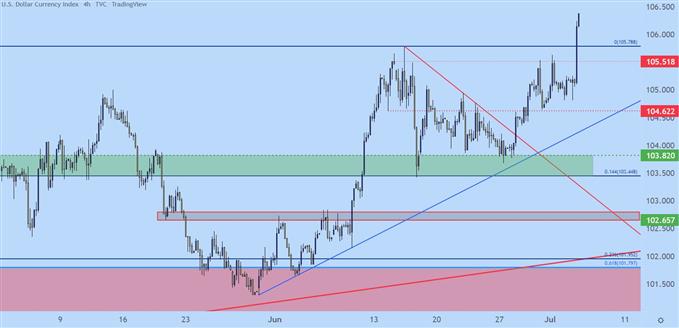
Chart prepared by James Stanley; USD, DXY on Tradingview
EUR/USD
The Euro has just set a fresh 19-year-low against the US Dollar. To consider that this didn’t happen throughout the European Debt Collapse or the Global Financial Collapse really puts into scope just how meaningful this move is. And, it also begs the question ‘Is parity possible?’
This has been something I’ve heard at various times since I moved into FX and, to date, it hasn’t happened. But sellers are remaining vigilant here and it appears as though we may be at an inflection point for representative Central Banks.
As we saw on Friday inflation in Europe remains above 8%. The ECB, at this point, doesn’t appear too anxious about that. On the other side of the Atlantic, inflation also remains above 8% but the FOMC is taking a far different approach to the matter – hiking rates with a priority towards tempering inflation.
This deviation creates even more divergence in the EUR/USD pair and, eventually, that parity level could be traded very quickly if something doesn’t change.
There’s some support potential around the 1.0250 psychological level but, for Q3, there’s really just one zone that matters in EUR/USD and that runs from the .99 handle up to the parity level.

EUR/USD Monthly Price Chart
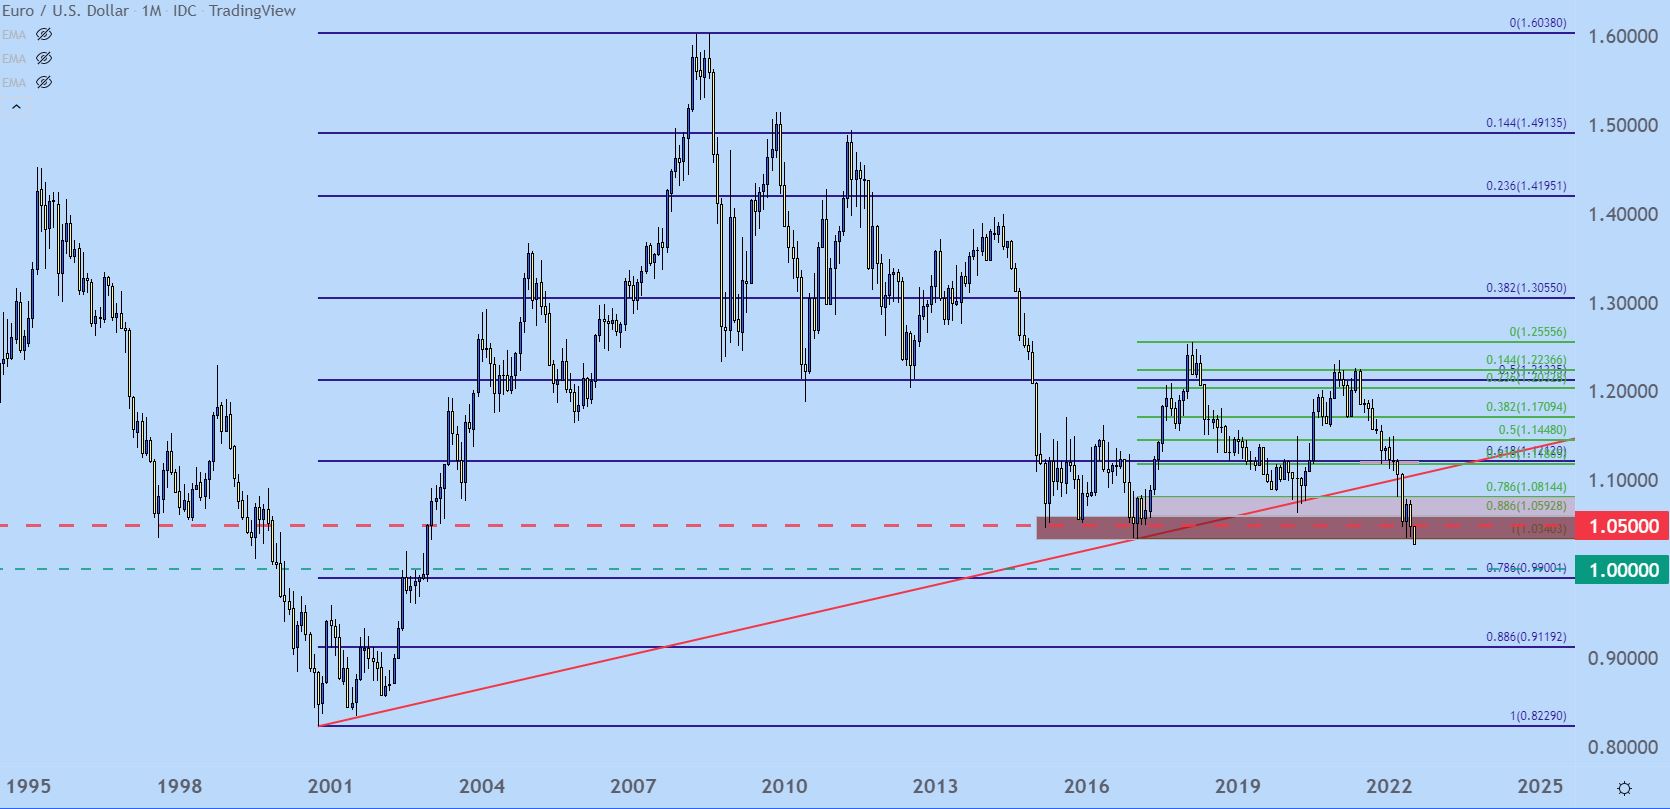
Chart prepared by James Stanley; EURUSD on Tradingview
GBP/USD Breakdown
Last week saw GBP/USD calm, at least early in the week, as a rectangle formation had built. That started to break on Wednesday, however, and that move has since continued.
As I looked at on Thursday, there was even some resistance showing up at an old support level, just before prices punched down for another test below the 1.2000 psychological level. We’re now testing the low that was set on the prior test below 1.2000. Chasing here could be imprudent, but looking for a resistance test around prior support could be a manner of approaching the bearish trend without trying to chase the move.

GBP/USD Four-Hour Chart
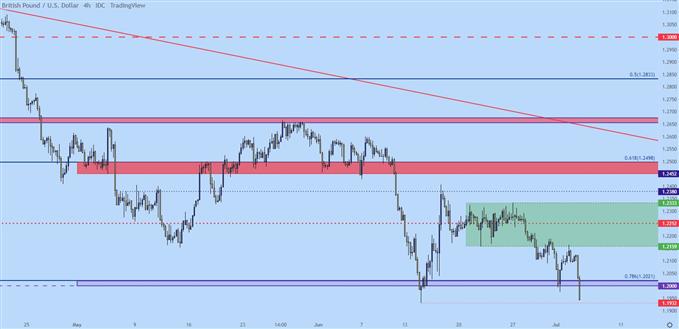
Chart prepared by James Stanley; GBPUSD on Tradingview
USD/CAD Above 1.3000
I looked into the technical backdrop behind USD/CAD last week and the longer-term chart remains of interest.
There have been two different resistance inflections at 1.3077, setting up a possible double top formation. But – if price jumps through that resistance, we have not only a nullification of the double top but we’d also have a pretty strong bullish breakout on our hands.
And taking a step back, there’s a longer-term ascending triangle that remains in-play, which could support the long side of a bullish breakout.
How this plays really just depends on how buyers treat the next test of that 1.3077 level.
That’s still early, however, as I had highlighted last week, there’s been a propensity for buying pressure to dry up above the 1.3000 psychological level so until that resistance is traded through, there’s pullback potential here, especially for those looking for ways to fade this recent move of USD-strength.

USD/CAD Daily Price Chart
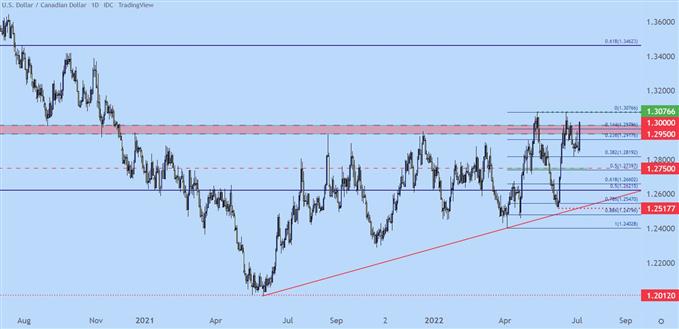
Chart prepared by James Stanley; USDCAD on Tradingview
USD/JPY Holds Support
Helping to fuel that move of USD-strength was continued weakness in the Japanese Yen. The support zone that I’ve been tracking from 134.48-135.00 continues to help hold the lows with yet another test last week.
Retail traders are and have been aggressively trying to call a top. As of this writing, 75% of retail holders in the IGCS study are holding net short USD/JPY positions, even despite the historic uptrend that’s shown over the past year.
I generally approach sentiment with a bearish lean, and the fact that so many retail traders are trying to call a top here keeps me on the bullish side, looking for another test of resistance at 136.71 followed by 137.00. After that, we have fresh 24-year highs. Support potential remains at 134.48-135.00 until it’s traded through.
To learn more about IGCS Sentiment:

USD/JPY Four-Hour Price Chart
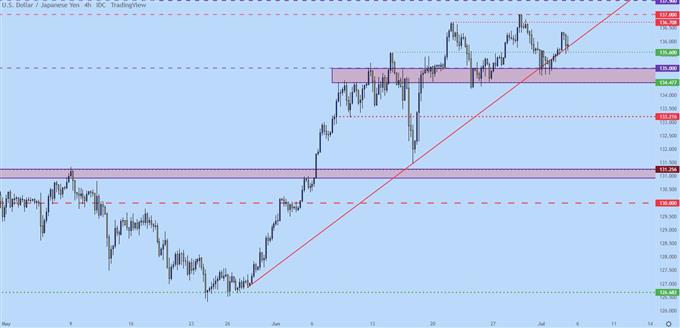
Chart prepared by James Stanley; USDJPY on Tradingview
--- Written by James Stanley, Senior Strategist for DailyFX.com
Contact and follow James on Twitter: @JStanleyFX


