


US Dollar Talking Points:
- The US Dollar break out ran into this morning, after which prices began to pullback following the release of PCE data for the month of May.
- Today is the final day of Q2 and the door remains open for additional strength into Q3, as I had shared in our technical forecast for Q3 in the USD. To access our trading forecasts, the link below will set that up.
- The analysis contained in article relies on price action and chart formations. To learn more about price action or chart patterns, check out our DailyFX Education section.

We’re now in the final day of Q2 trade and it’s been a brutal outing for equities. The Nasdaq 100 is currently looking at its second worst quarterly loss since the year 2000, only eclipsed by October of 2008 which marked the bottom of the Global Financial Collapse. And there’s still some day left, so we may end up seeing sellers push that to the biggest loss in a quarter.
But there’s a relationship here: Higher rates are helping to push stocks lower and that has a link to FX in the massive bullish trend that’s built-in to the US Dollar over the past year. As inflation continues to rage, rate expectations continue to drive-higher, and stocks continue to fall-lower. That theme looks set to continue into Q3 but this morning brought a very slight glimmer of hope on the matter. Core PCE printed inside of expectations, coming in at 4.7% v/s the 4.8% expected.
That’s helped to bring a bit of pullback to the US Dollar which was in the process of breaking out coming into this morning. The currency found support at the 103.82 level that I had highlighted on Tuesday, and as of this writing, prices remain above the 105.00 psychological level.
This pullback may have more to do with EUR/USD than the PCE print itself, although it’s likely a combination of both. But I’ll take a deeper look into EUR/USD below our next chart.
US Dollar Four-Hour Chart
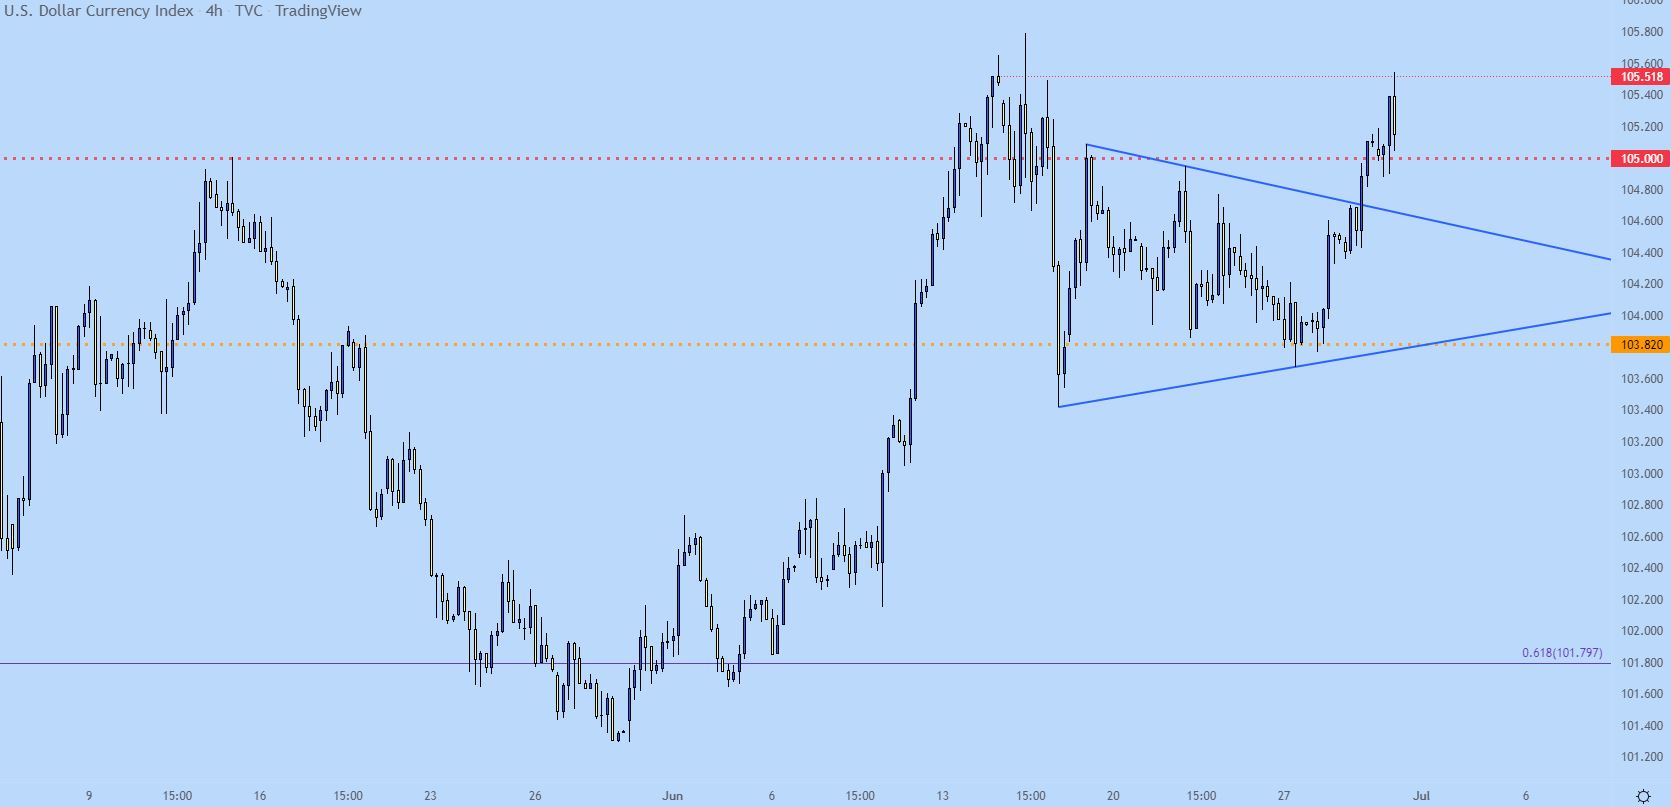
Chart prepared by James Stanley; USD, DXY on Tradingview
EUR/USD Nears Major Support
The US Dollar is trading at a fresh 19-year high. USD/JPY is at a fresh 24-year high. EUR/USD, as yet, hasn’t been able to punch below its own 19-year-low.
It’s come close: That low is at 1.0340 and was set in 2017. In May, EUR/USD was hurdling-lower, but pulled up just short of that level at 1.0349. And then again, in June, the pair was punching-lower and a higher-low developed, this time at 1.0359.
At that point I started to look for a pullback in the move but that was cut short, with sellers coming in at the same resistance that’s held the highs for the past couple of weeks at 1.0593.
Sellers are making another attempt at support and so far, that attempt has fallen short. But, this carries breakdown potential into Q3 and the fundamental side is a major driver that doesn’t look to let up anytime soon.
At this point, resistance potential remains at the 1.0500 psychological level.

EUR/USD Four-Hour Price Chart
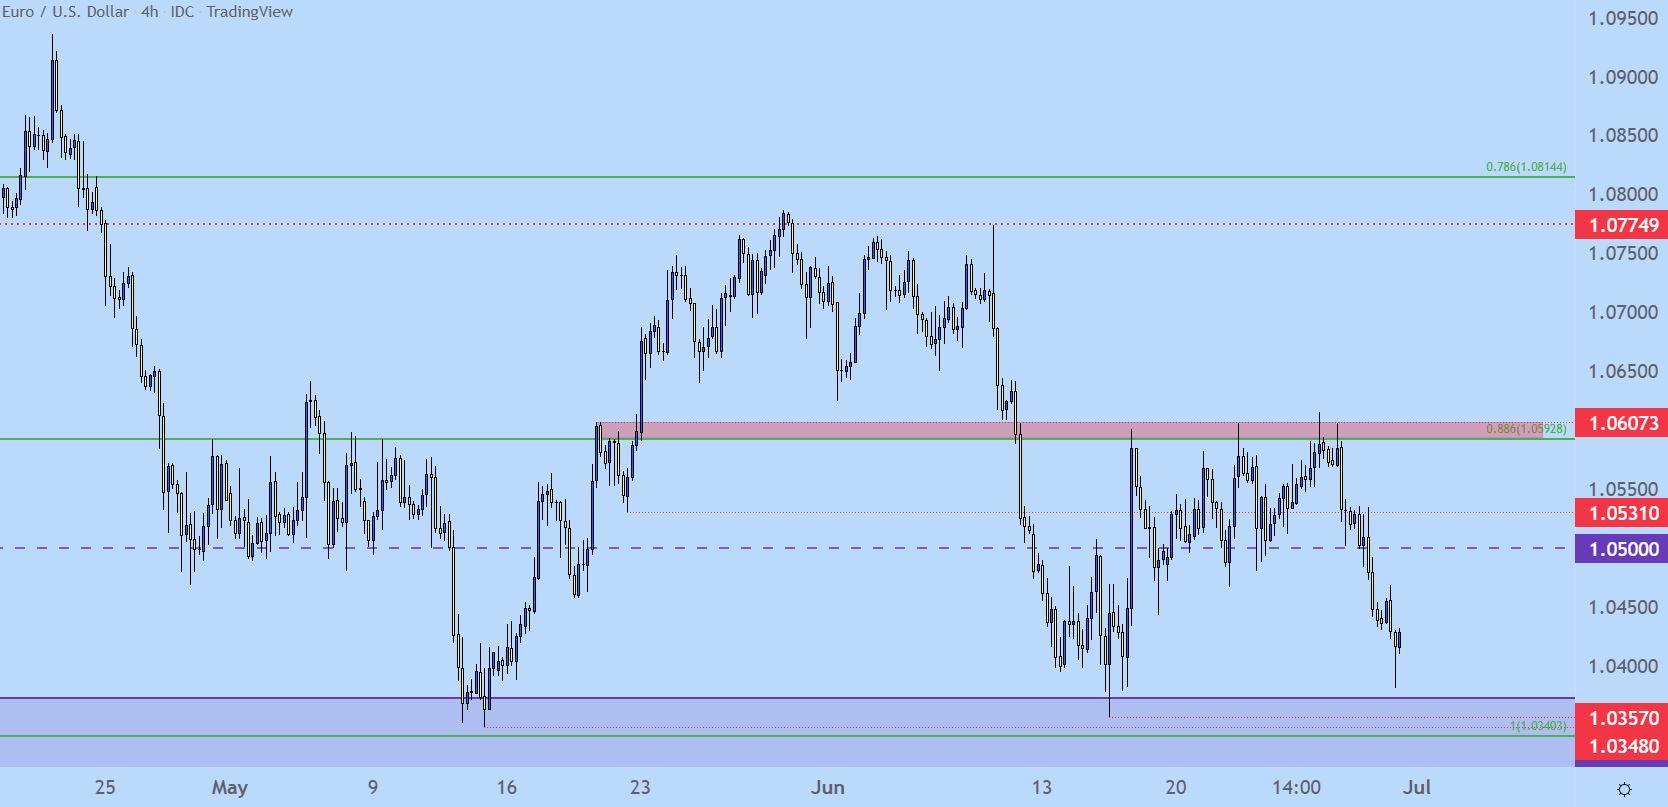
Chart prepared by James Stanley; EURUSD on Tradingview
GBP/USD Cable Box Breaks
I had looked at a rectangle formation in GBP/USD on Tuesday, with focus on the level at 1.2159. That level broke yesterday and prices found support at the 1.2100 level. That bounce has since found resistance at prior support, keeping the door open for bearish trend scenarios.
For longer-term support, the zone at the 1.2000 psychological level, running up to the Fibonacci level at 1.2021 remains a key focal point.

GBP/USD Four-Hour Price Chart
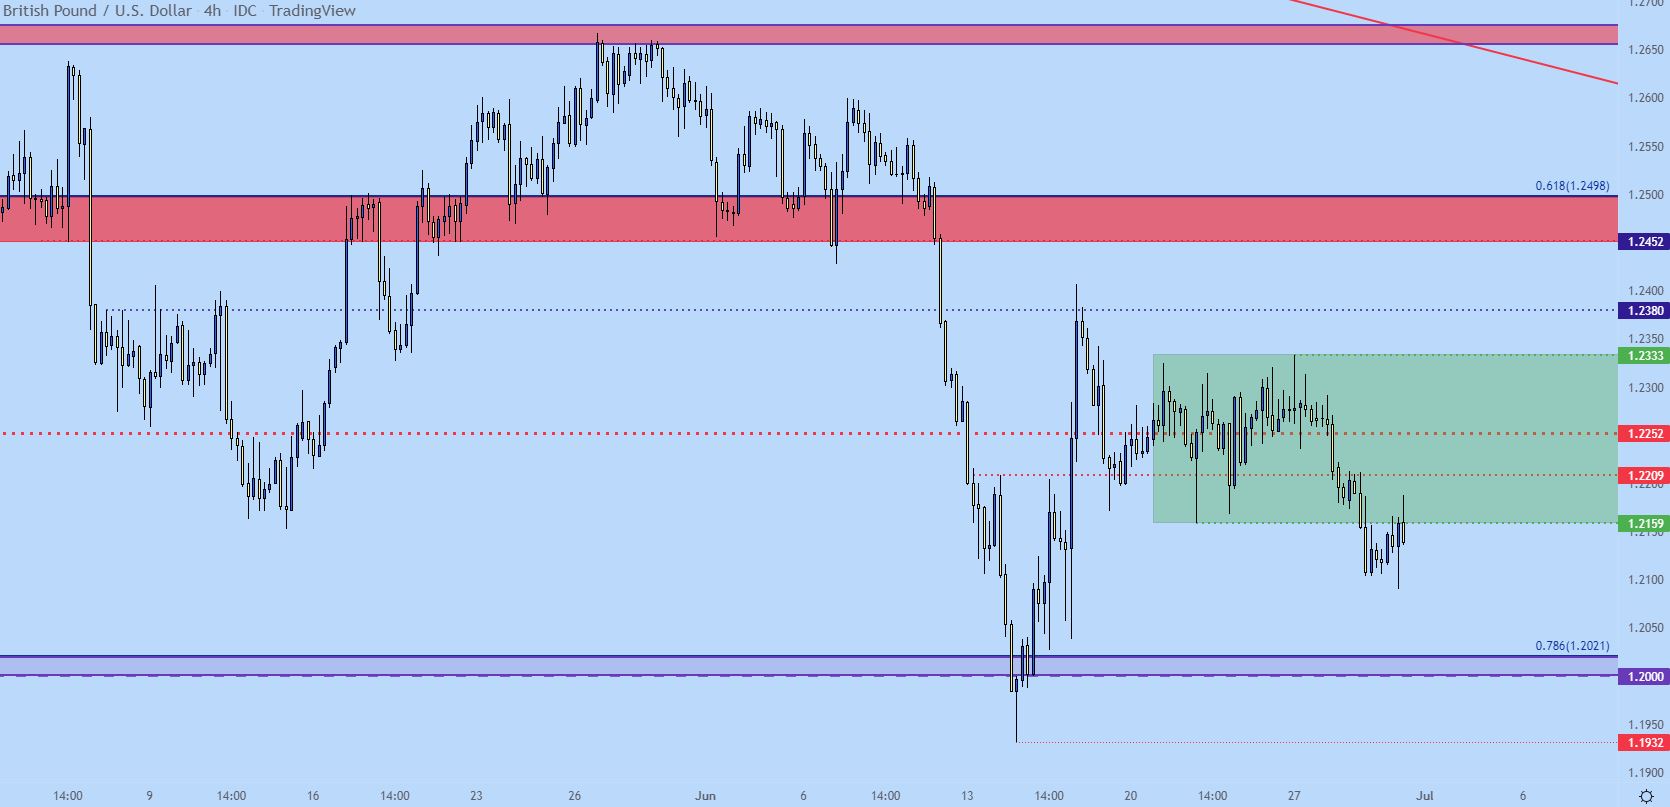
Chart prepared by James Stanley; GBPUSD on Tradingview
USD/CAD
USD/CAD goes into Q3 with some interesting potential. There’s a longer-term double top formation with about 560 pips of distance between the top and the neckline of the formation. If that fills and completes, that projects to USD/CAD spot prices below the 1.2000 level. It can be difficult to imagine that scenario happening especially as soon as Q3, but the technical formation is what it is and, if it doesn’t fill, there’s breakout potential at that 1.3077 price that’s already rebuked bulls twice in Q2.
For now, there appears to be some bearish potential here for those that’d like to fade this USD strength, with prices holding below a resistance zone running from 1.2950-1.3000. The recent low printed off of the 38.2% Fibonacci retracement, so next support could be sought out in the zone between the 1.2750 psychological level and the Fibonacci level at 1.2740.

USD/CAD Daily Chart
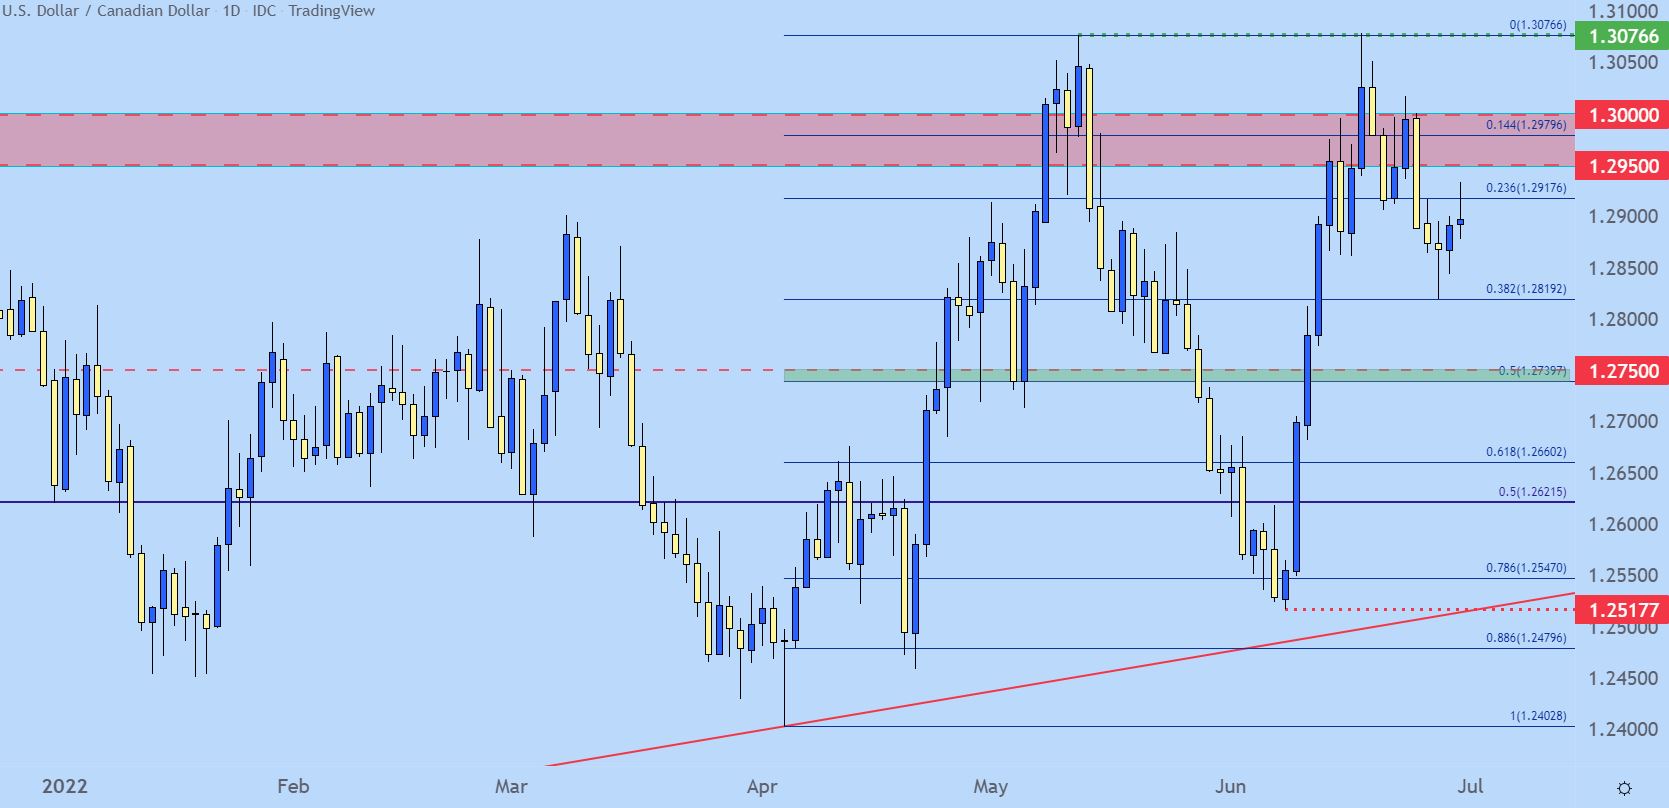
Chart prepared by James Stanley; USDCAD on Tradingview
USD/JPY
One of the strongest trends of Q2 and the first half of 2022 is currently pulling back. USD/JPY set a fresh 24-year high yesterday and markets are carefully watching the Bank of Japan’s bond buying activities, trying to monitor when the bank may begin to shift policy. Earlier in the week, Kuroda seemingly kept the door open to Yen-weakness, which allowed for that fresh high to print. But, the lack of continuation after the high indicates one of two things and likely a combination of both: either a) jitters about a possible shift in that bond buying policy or b) an extreme overbought condition, and I’m not necessarily referring to RSI here.
From the daily, it does appear that there’s remaining bullish potential with price holding in an ascending triangle although that short-term support is currently being tested. Deeper swing support at 134.27 is key for the bullish theme to remain as a breach below opens the door for a trickle down to the 132.50 psychological level.

USD/JPY Daily Chart
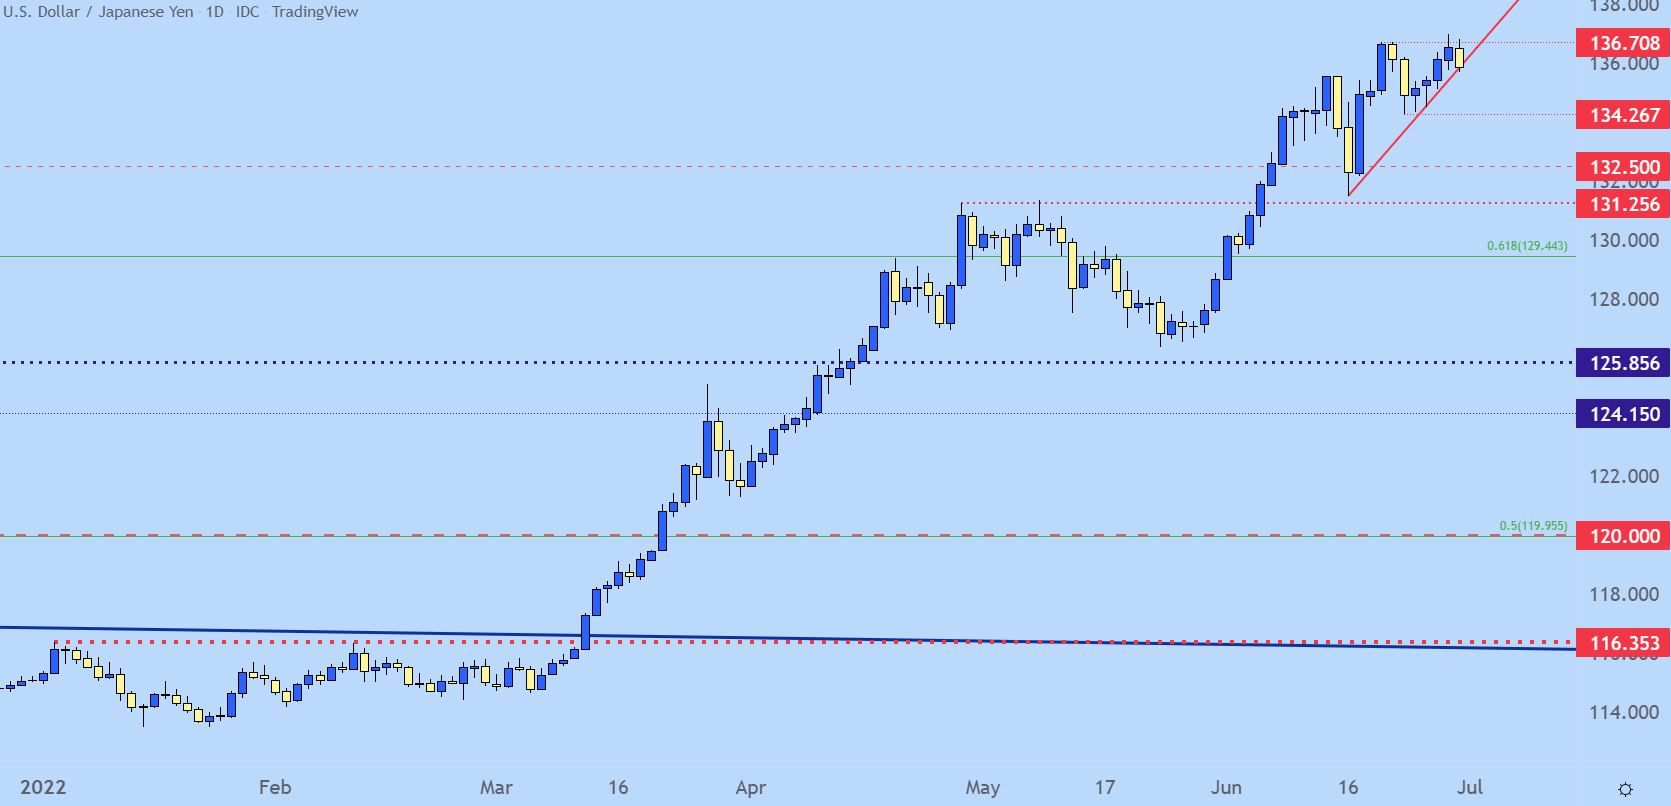
Chart prepared by James Stanley; USDJPY on Tradingview
--- Written by James Stanley, Senior Strategist for DailyFX.com
Contact and follow James on Twitter: @JStanleyFX


