


Since March 7th peak at 5.03, we have been witnessing a 35% decline until present in Copper. This decline has been continuous, but we are seeing some clues on the charts on the technical side that an overdue stall awaits in Copper.
Let’s look at the weekly chart.
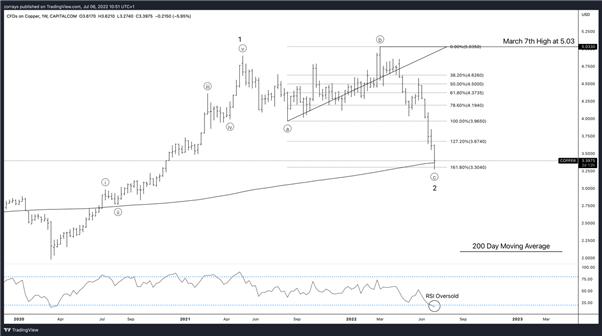
Fibonacci Inversion at 161.8% Level
First clue by just looking at the weekly timeframe is that Copper has reached 161.8% Fibonacci Inversion extension level at 3.30.
The significance of using this Fibonacci tool in this manner measures whether an instrument is overstretched prior to a correction or if there is further room in the current rally. You may also notice that the price was very steep without a major correction since the March 7th highs.
200 Day Moving Average
This Fibonacci Inversion 161.8% level is confluence with the 200 Day Moving Average. This is not to say that the price will not break through the Moving Average but we can certainly use this combined with the Fibonacci Level as a dynamic support area.
RSI Oversold
Usually, I like to stick to using RSI to spot divergences but that is usually on lower timeframes e.g. Daily, H4 and H1 etc. But in this case, as this is a weekly chart, the RSI combined with above is looking pretty much oversold right now. This could be to do with the fact that Copper has not formed a significant correction since the March 7th high. And RSI has been unfolding new lows with the price action that was offered by Copper.
Elliott Wave Count
Finally, according to count on the weekly chart, there is a 1-5 sequence impulse wave throughout the Covid-19 pandemic as Copper’s price appreciated. This formed Wave 1.
Although we did see a new extreme form at that March 7th high, but price did not unfold in a 5-wave sequence and instead in a 3-wave sequence. This is a huge clue that since the peak of wave 1 – price has been within a corrective pattern, Expanded Flat.
This extreme decline is all corrective against the appreciation witnessed during the Covid-19 pandemic, therefore, we are waiting for wave 2 to bottom out prior to the advance.


