


US STOCKS OUTLOOK:
- U.S. stocks plunge across the board as traders cut risk exposure ahead of U.S. CPI data
- The S&P 500 falls 2.38% and reaches its lowest level in two weeks, the Nasdaq 100 plummets 2.74%
- If the May U.S. inflation report surprises to the upside, U.S. Treasury yields could accelerate their advance on hawkish repricing of Fed policy outlook
Trade Smarter - Sign up for the DailyFX Newsletter
Receive timely and compelling market commentary from the DailyFX team
Most Read: S&P 500 Breaks Box, Sets Fresh Low Ahead of U.S. CPI. What’s Next?
U.S. stocks plunged on Thursday on sour market sentiment amid growing anxiety over the economic outlook ahead of a key inflation release before the weekend. At the closing bell, the S&P 500 fell 2.38% to 4,017, hitting its lowest level in two weeks, undermined by a 9% spike in the VIX index. Meanwhile, the Nasdaq 100 led losses on Wall Street, plummeting 2.74% to 12,269 on widespread tech sector weakness, with Apple, Microsoft and Amazon sinking 3.6%, 2.08% and 4.15% respectively.
Investors de-risked their portfolios aggressively and rushed to buy downside protection on fears that upcoming U.S. CPI data could surprise to the upside, leading traders to increase bets that the Federal Reserve will continue to raise interest rates in 50 basis points increments well beyond its July meeting in order to restore price stability. A more hawkish tightening cycle than currently priced in will push U.S. Treasury yields higher, exacerbating pessimism about the economy and creating a more hostile environment for equities.

Focusing on the calendar, the U.S. Bureau of Economic Analysis is scheduled to release its latest consumer price index report on Friday morning. In terms of forecasts, May’s CPI is seen rising 0.7% m-o-m and 8.2% y-o-y. Meanwhile, the core gauge, which excludes volatile items, is anticipated to climb 0.5% m-o-m and 5.9% y-o-y according to analysts surveyed by Bloomberg News.
Although annual readings are expected to ease for both indicators compared to April’s figures, the directional improvement is likely to be modest, especially for the headline index due to higher energy and food costs. If the results top estimates by a wide margin, the Fed is likely to signal next week at its June FOMC meeting that it may have to front-load policy adjustments more expeditiously to cool demand and prevent inflation from spiraling out of control. This scenario could trigger the next leg lower on Wall Street.
| Change in | Longs | Shorts | OI |
| Daily | -6% | 2% | -2% |
| Weekly | -9% | -3% | -6% |
S&P 500 TECHNICAL ANALYSIS
The S&P 500 traded horizontally over the past few days, but consolidation finally resolved to the downside on Thursday, with the index breaching technical support spanning from 4,070 to 4,050. Following this bearish breakout, the near-term outlook has worsened for the equity benchmark, creating the right conditions for a move towards the psychological 4,000 level, the last line of defense before the 2022 lows come back into play. On the flip side, if dip buyers resurface and manage to spark a bullish reversal, initial resistance appears at 4,050/4,070, followed by 4,195, an area defined by the 38.2% Fibonacci retracement of the 2022 decline.
S&P 500 TECHNICAL CHART
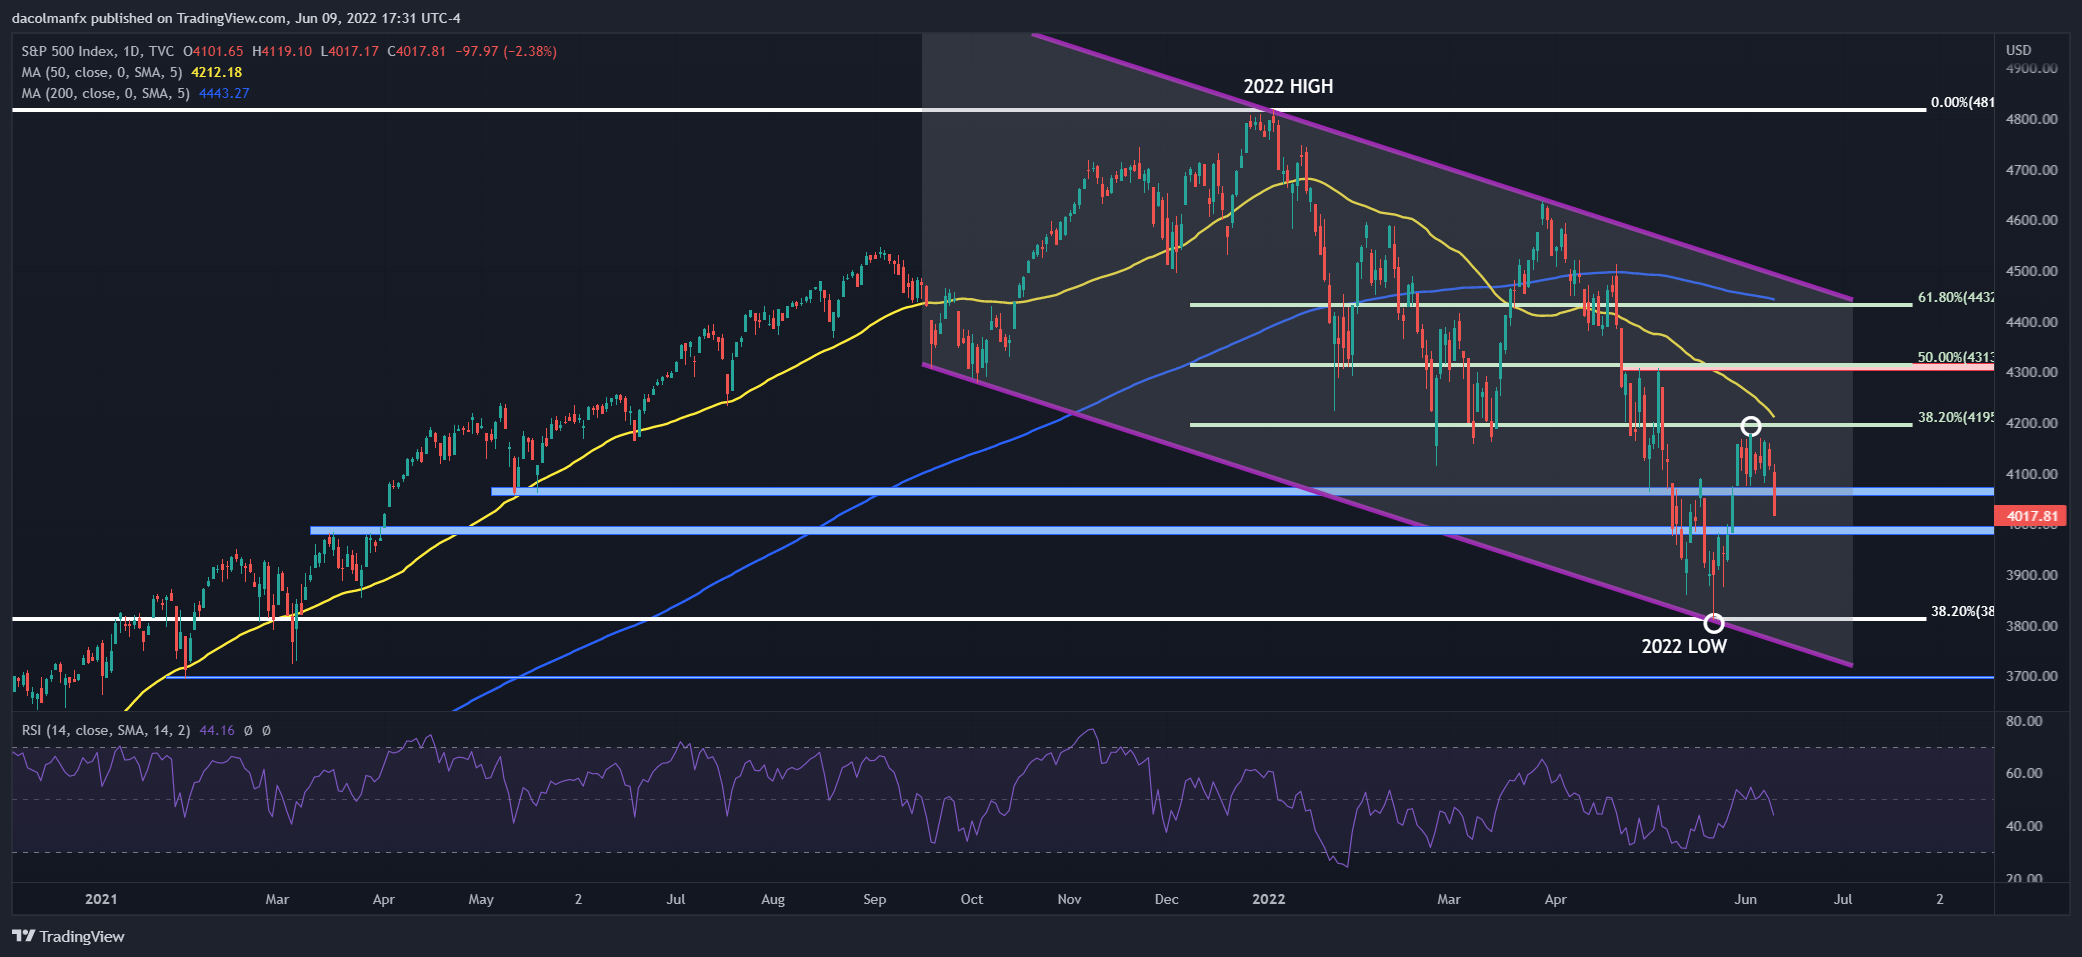
S&P 500 Technical Chart Prepared Using TradingView
EDUCATION TOOLS FOR TRADERS
- Are you just getting started? Download the beginners’ guide for FX traders
- Would you like to know more about your trading personality? Take the DailyFX quiz and find out
- IG's client positioning data provides valuable information on market sentiment. Get your free guide on how to use this powerful trading indicator here.
---Written by Diego Colman, Market Strategist for DailyFX


