
US STOCKS OUTLOOK:
- S&P 500 and Nasdaq 100 rise for the second day in a row
- The pullback in the VIX boosts risk appetite, but lingering concerns about the economy limit optimism
- May U.S. inflation data will be the next big catalyst for stocks
Trade Smarter - Sign up for the DailyFX Newsletter
Receive timely and compelling market commentary from the DailyFX team
Most Read: S&P 500 Forecast for the Week Ahead - Inflation Data to Make or Break the Market
U.S. stocks pushed higher on Tuesday, building on Monday’s modest advance, though gains were moderate amid mounting worries about the economic outlook. Traders were caught off guard after Target, one of the largest retailers in the country, issued the second profit warning in three weeks, cutting its expected operating margin for the current fiscal quarter by more than half amid a struggle to clear unwanted inventories.
When it was all said and done, the S&P 500 rose 0.95% to 4,160, steadily approaching a key resistance near the psychological 4,200 level. The Nasdaq 100 also trekked upwards, advancing 0.89% to 12,712, bolstered by a pullback in U.S. Treasury rates, with the 10-year yield falling back below the 3% mark.
With the VIX in retreat and at its lowest levels since April 22, there is room for stocks to continue their recovery, but the upside will likely be limited amid fragile sentiment and lingering headwinds, including rising inflation, slowing economic growth, and softening corporate earnings.
Looking to the next price action catalysts, the U.S. economic calendar is thin for the next few days, but Friday could deliver a punch with May inflation data on tap, a high-impact event for financial markets. In terms of expectations, headline CPI is seen advancing 0.7% month-over-month, driven by spiking energy costs. With this increase, the annual figure is forecast to remain unchanged at 8.3%, a sign that the U.S. central bank has a long way to go to restore price stability.

Heading into the second half of the year, inflationary pressures will likely struggle to moderate meaningfully due to renewed strength in commodity prices, with WTI oil and natural gas resuming their explosive ascent in recent weeks.
The current situation may leave the Fed with no choice but to keep raising interest rates in 50 bps increments through the end of the year, a scenario not yet priced in. A very hawkish monetary policy outlook will push U.S. yields even higher than they are, fueling recession fears and creating a hostile environment for risk assets. For this reason, traders should keep a close eye on the upcoming CPI data, examining the report for clues on the trajectory of inflation in light of recent developments.
| Change in | Longs | Shorts | OI |
| Daily | 1% | -4% | -2% |
| Weekly | -2% | -8% | -5% |
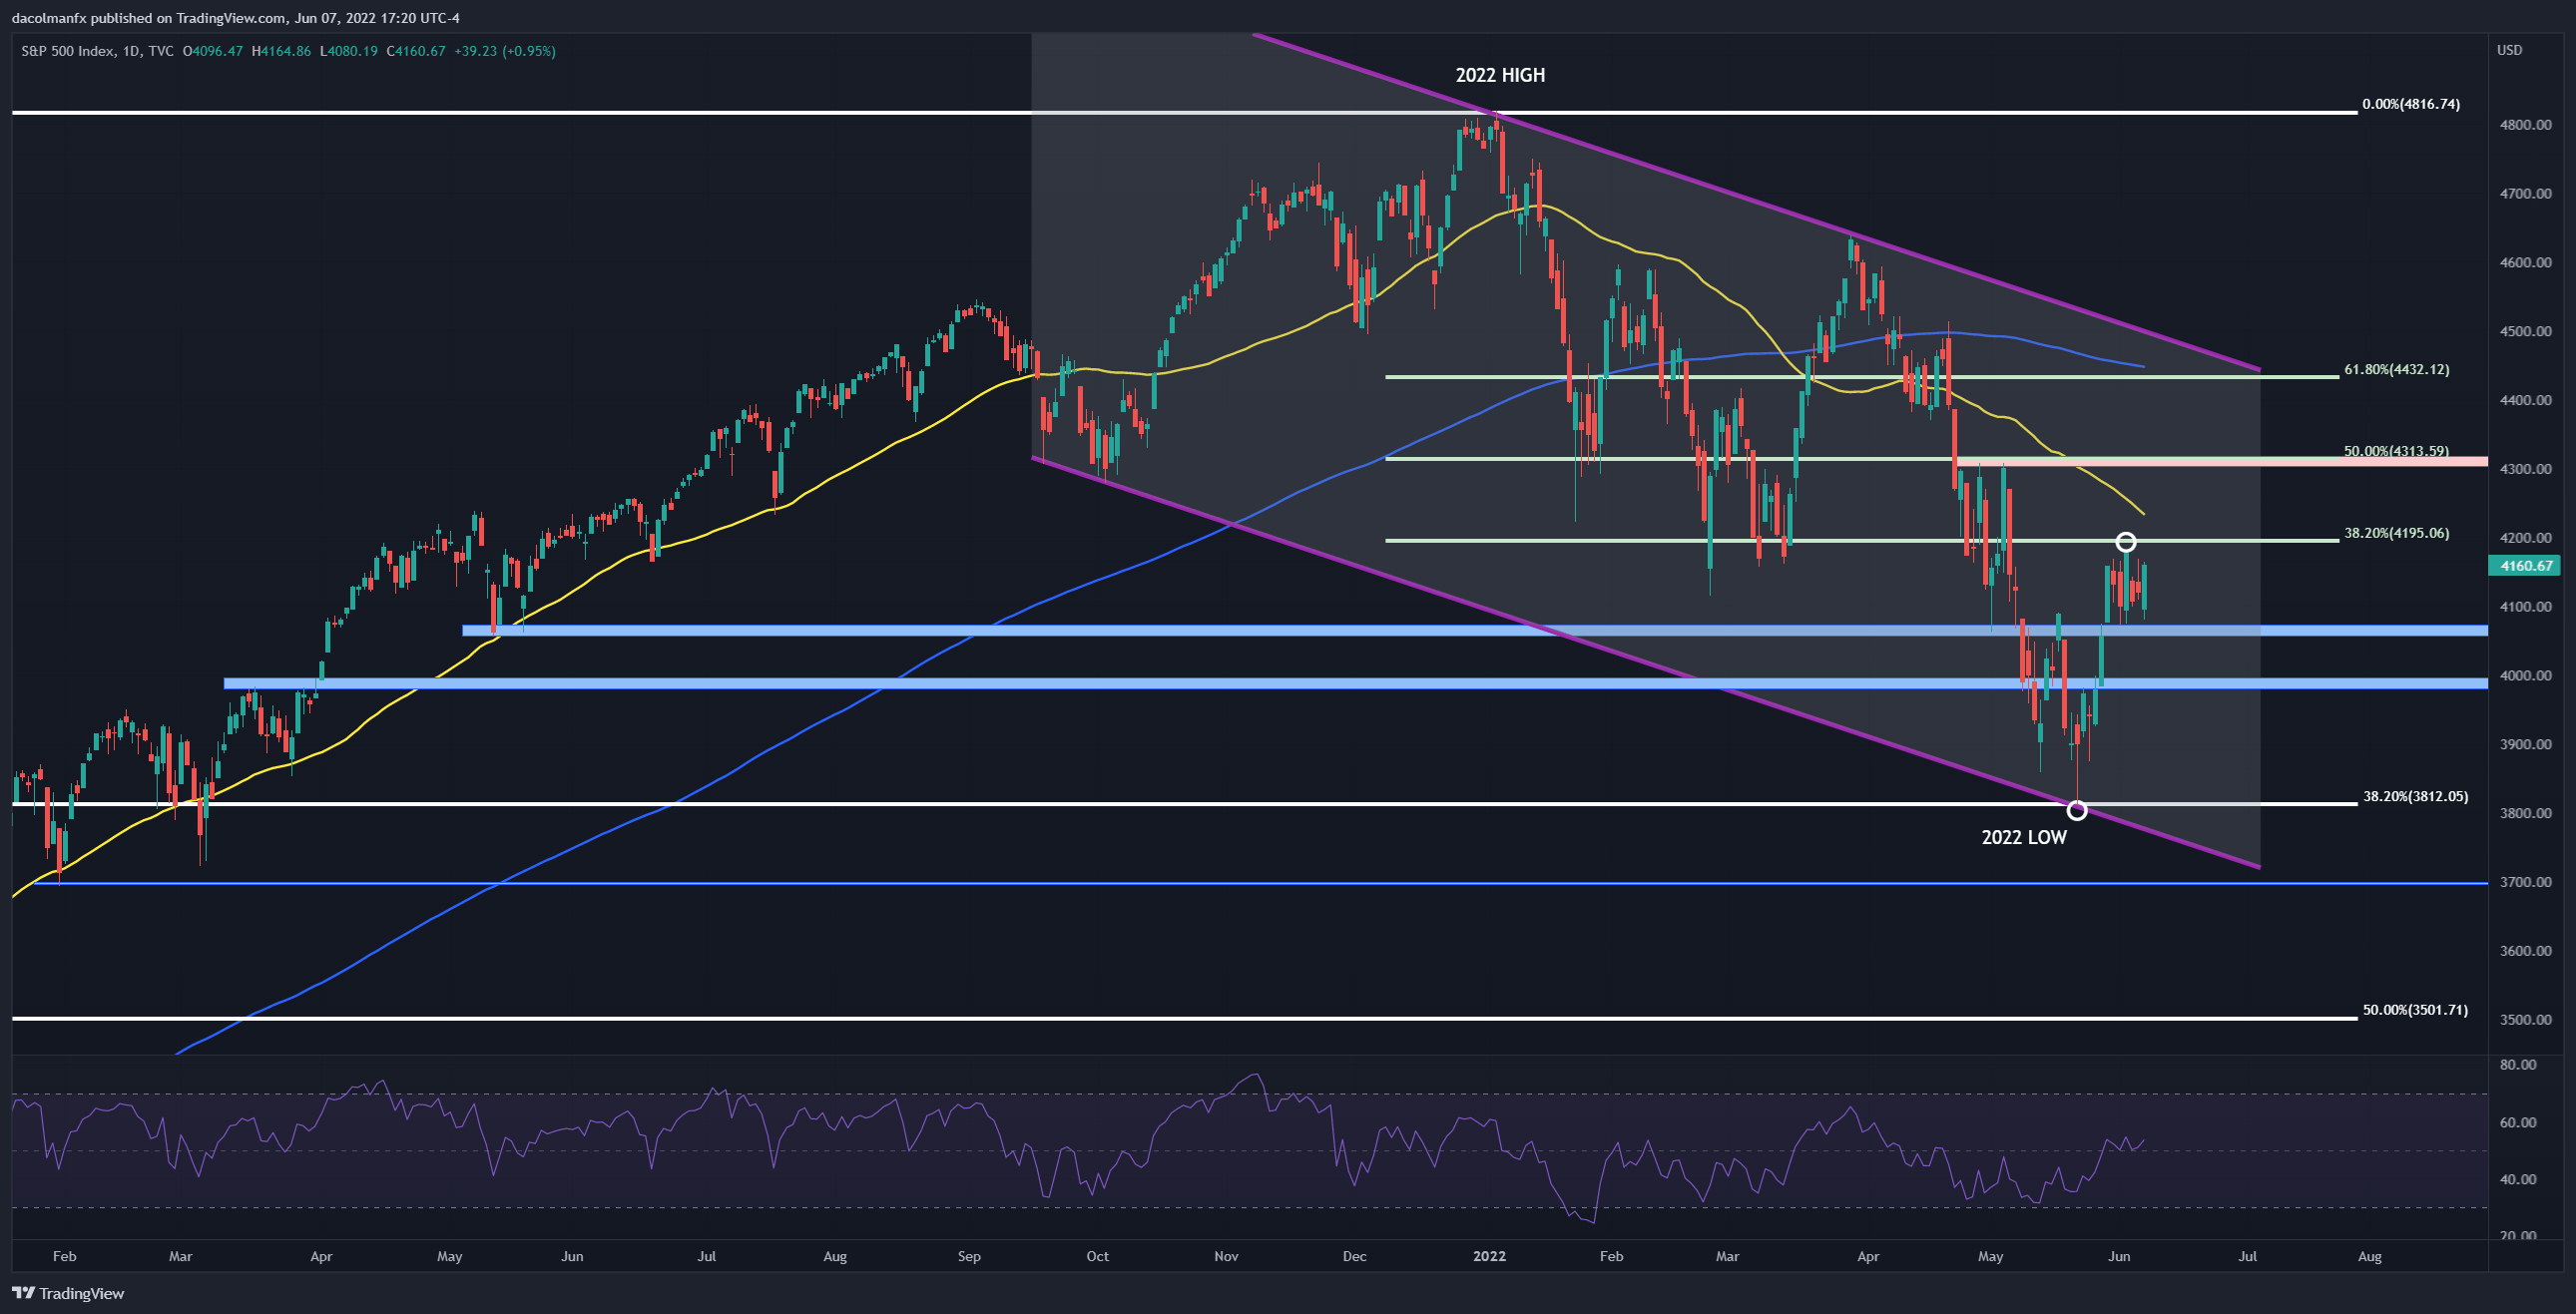
S&P 500 TECHNICAL ANALYSIS
Looking at the S&P 500 daily chart, it appears that the index is in consolidation mode, trapped between technical support at 4,070/4,050 and resistance near 4,195, an area defined by the 38.2% Fibonacci retracement of the 2022 decline. Having said that, if prices break out on the topside, bullish impetus could pick up pace, exposing the 50-day simple moving average, followed by 4,313.
On the flip side, if consolidation resolves to the downside and prices breach the 4,070/4,050 zone, we could see a move towards the psychological 4,000 level. On further weakness, the focus shifts lower to the 2022 lows near 3,810.
S&P 500 TECHNICAL CHART