


S&P 500 Talking Points:
- The S&P 500 has set a fresh low ahead of tomorrow’s CPI report, putting in a break in the final hour of the U.S. equity session.
- Longer-term bearish potential remains but the timing of this break should be construed cautiously as major event risk is on the horizon. After tomorrow’s CPI report the focus shifts back to the FOMC for next week’s rate decision.
- The analysis contained in article relies on price action and chart formations. To learn more about price action or chart patterns, check out our DailyFX Education section.

It’s been a busy session so far after the ECB rate decision earlier this morning. The ECB came out more dovish than many had expected and this has led to a run of weakness in the Euro.
But, shortly after that rate decision attention started to turn back to the other side of the Atlantic with tomorrow’s U.S. CPI report set to be released at 8:30 AM ET. That, of course, leads into next week’s FOMC rate decision where the bank is expected to hike by 50 basis points while sharing their plans for the rest of the year via the Summary of Economic Projections (SEP).
For the past two weeks U.S. equities have remained in a rather tight range, building a ‘box’ or ‘rectangle’ formation as price was bound between support and resistance. Such formations can often show up ahead of a big driver: Market makers, like most traders, don’t want to take losses if they can help it and with a major driver on the horizon, this can compel a lack of activity.
Boxes can be interesting technical formations to work with. Realistically it’s trading a range break, more or less, as the build of the box is also the build of a range. But as that range breaks on shorter-term charts, the box gives way on longer-term looks and that opens the door for possible continuation.
The box that’s built in the S&P 500 is breaking in the final hour of trade in the US session ahead of tomorrow’s release of CPI data from the U.S.
SPX Four-Hour Price Chart
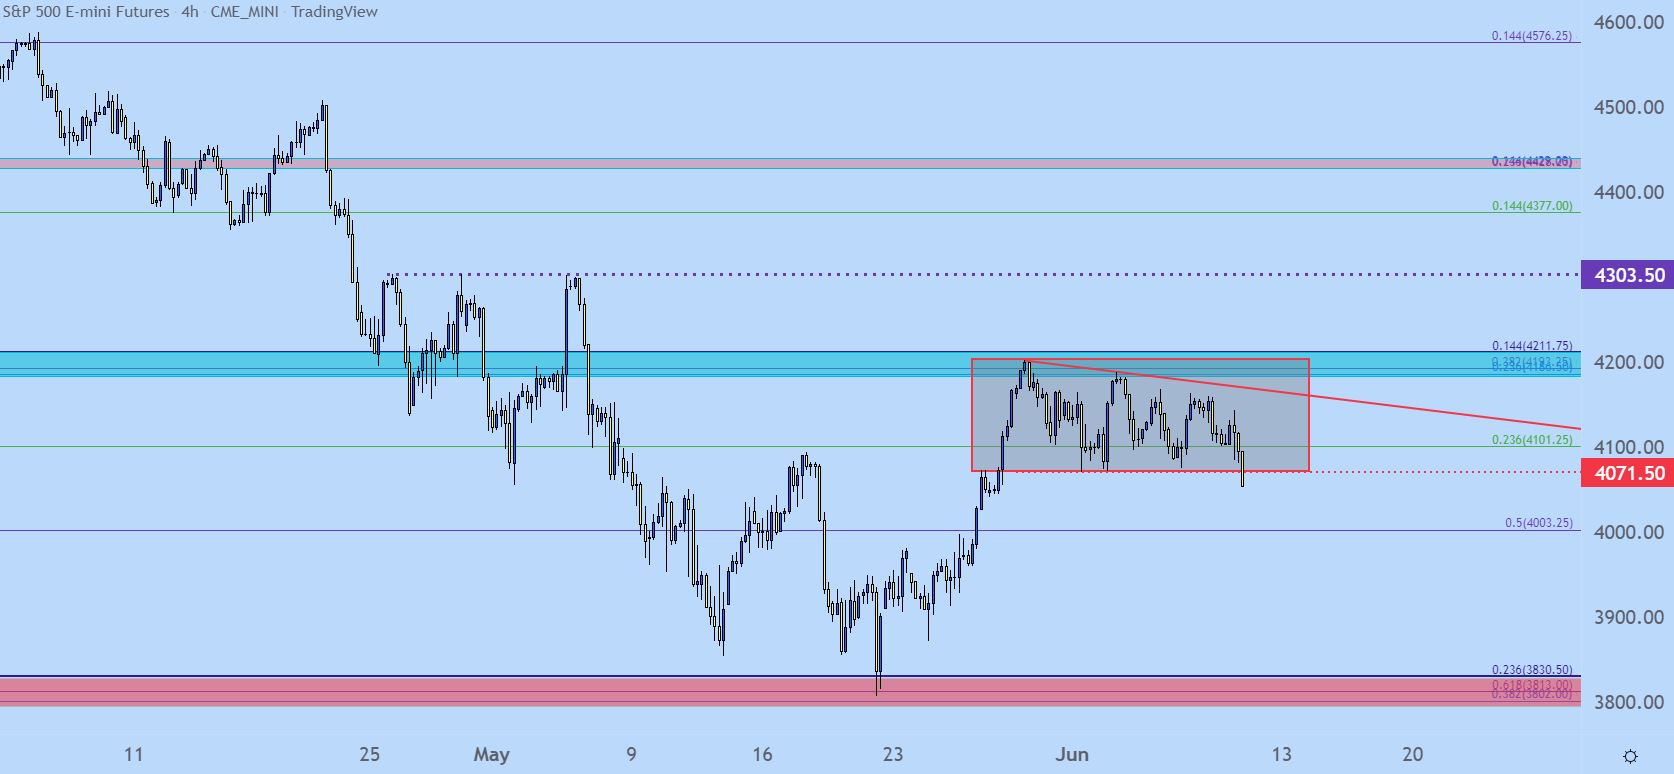
Chart prepared by James Stanley; S&P 500 on Tradingview
SPX Shorter-Term
The fear here is that this break is a trap. Given that sellers waited for two weeks and didn’t pose the bearish move until there was an hour left to go – with no specifically definable drivers provoking such a move – and traders would be rightfully cautious for treating this theme carefully.
As for next supports, there’s a possible spot at a prior swing low around 4041 and, below that, we have the psychological level at 4k that’s confluent with the 50% marker of a Fibonacci retracement.
S&P 500 Two-Hour Price Chart
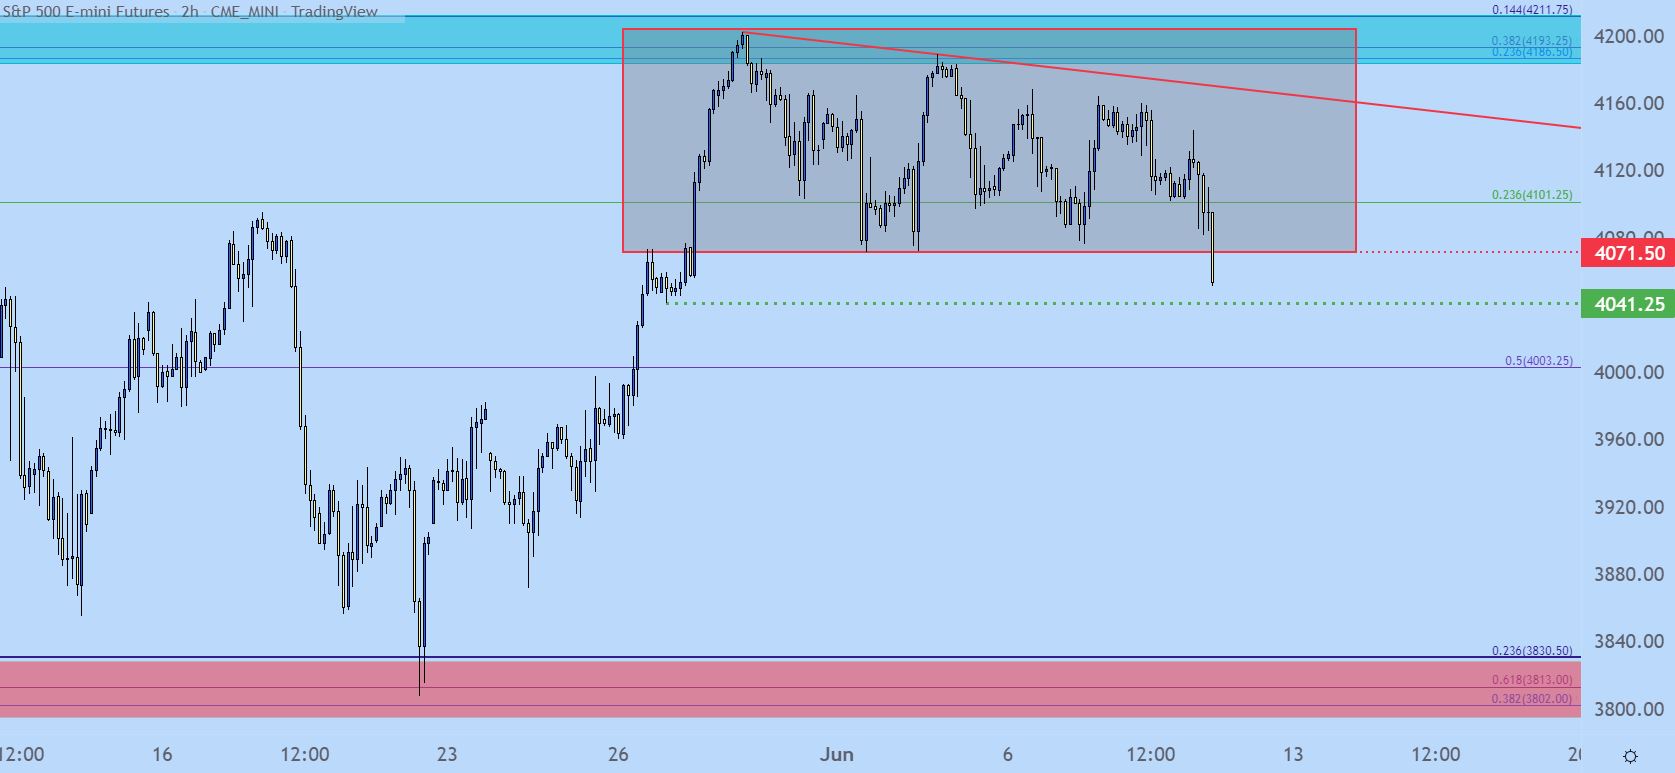
Chart prepared by James Stanley; S&P 500 on Tradingview
S&P 500 – The Bigger Picture
The more interesting setup here, in my opinion, is of the longer-term variety. The bearish trend hit heavily in U.S. equities in the first five months of this year. But, more recently, that trend has been on break as prices have pulled back from oversold conditions after running into a big spot of support.
In the S&P 500, that support was at the 38.2% retracement of the pandemic move, which led to a bounce up to the 23.6% retracement of that same major move. I discussed this in-depth in yesterday’s article on the topic.
But the primary allure of this setup is the prospect of the bigger picture bearish trend coming back to order. Which also means that bears can wait for a bit of confirmation because if that theme is, in fact, on its way back here ahead of tomorrow’s CPI data, there could be ample opportunity to work with it as the bearish trend comes back to order.
S&P 500 Weekly Chart
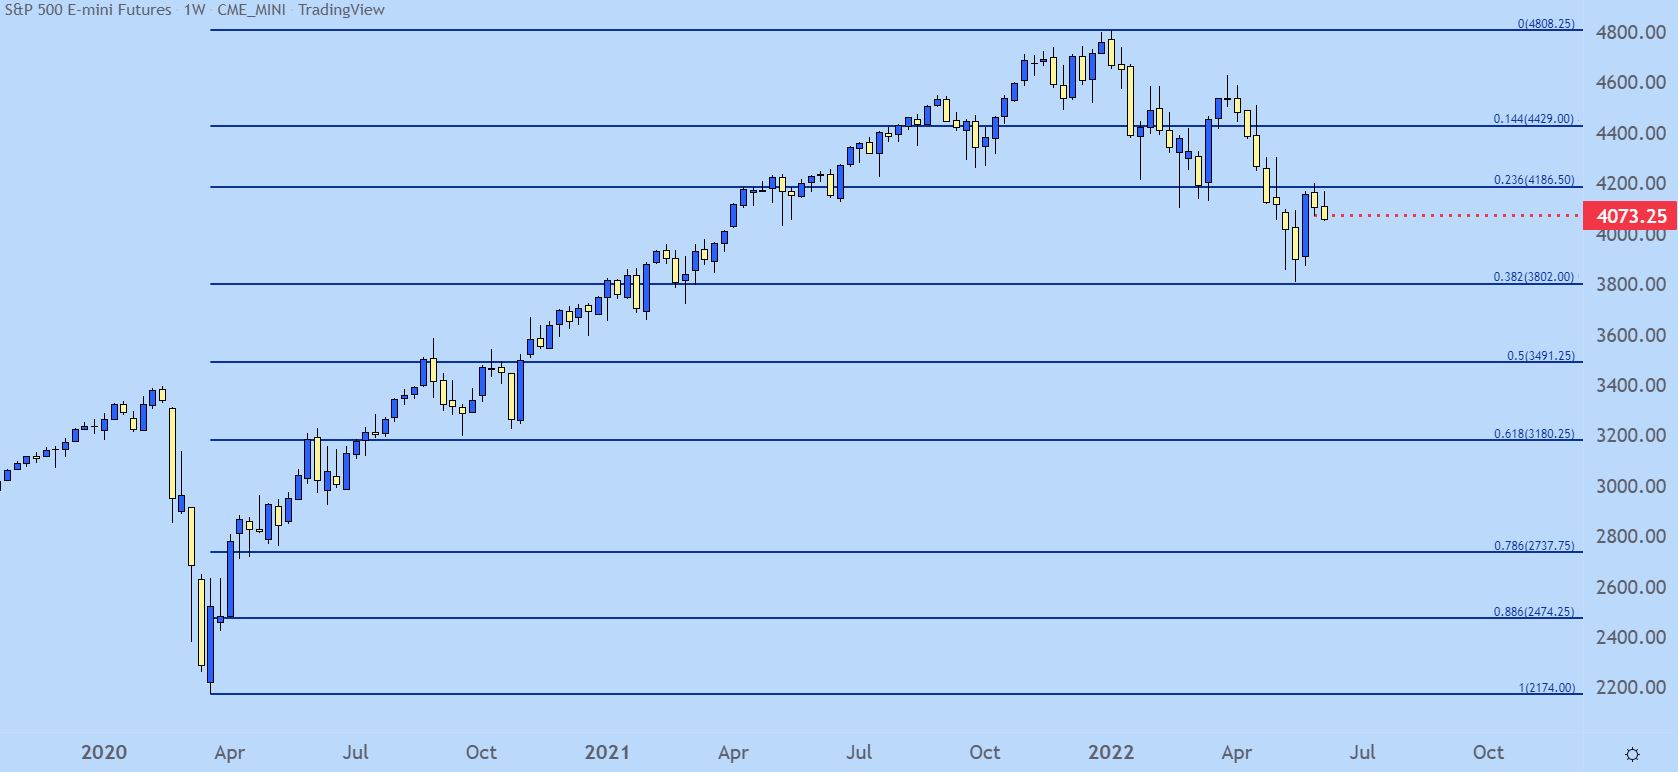
Chart prepared by James Stanley; S&P 500 on Tradingview
--- Written by James Stanley, Senior Strategist for DailyFX.com
Contact and follow James on Twitter: @JStanleyFX


