


S&P 500, Nasdaq Talking Points:
- U.S. stocks are stuck in a range that’s held over the past week. This range appeared after a pullback in a bearish move, which followed a test of key support in each of the S&P 500 and the Nasdaq 100.
- Tomorrow brings the ECB rate decision and Friday brings CPI, so there’s some significant macro risk on the calendar for the remainder of this week. And next week brings the FOMC rate decision with heavy expectations for another 50 bps of tightening. The bigger question – what else does the Fed have planned this year? That will be communicated in the accompanying SEP (Summary of Economic Projections) in which the Fed shares their forecasts for inflation, growth and rates in the coming months and years.
- We’ve been discussing these themes at DailyFX throughout 2022 and a host of analysts have taken bearish stances on US equities as ‘Top Trades’ for Q2. To get the full Top Trades installment, the link below will allow for access.

Markets have a tendency to do the opposite of what most are expecting…
After starting the year with some heavy trends in both directions, stocks have now spent the past week-and-a-half grinding inside of a range. From the daily chart, this has set up a ‘box formation’ which is one of the earliest technical formations ever plotted.
Boxes show equalized price action, often indicative of balance ahead of a major driver. With both buyers and sellers fearful of being caught offsides when that catalyst happens, this can lead to compression in price action similar to what we’ve seen of late. In the effort of approaching this with the most clarity, I’m going to address each of the S&P 500 and Nasdaq 100 in a tops-down manner.
From the weekly chart in the S&P 500, we can see that illustrious trend that developed on the heels of the pandemic. This move spanned from the low in March of 2020 up to the high in January of 2021 and this accounted for a 121.7% run. Along the way, the Fed continued to keep policy very loose, fearful that any tightening would choke off the recovery and harm the labor market. This allowed for inflation to build to its current state, which we’ll hear more about on Friday – but that also put the Fed in a position where they no longer had a choice, they had to look at rate hikes in the effort of buffering that inflation.
That’s what helped to shift the tides after the 2022 open, and as the Fed became more and more loud around this, sellers got more and more aggressive. This has led to a 38.2% retracement of that pandemic trend. That support came into play in mid-May and this also marked the -20% retracement marker, which denotes ‘bear market’ territory.
That support has since led into a bounce, with prices in the S&P 500 pushing up to the 23.6% Fibonacci retracement of that major move – and this level is currently helping to set short-term resistance in the index.
S&P 500 Weekly Price Chart
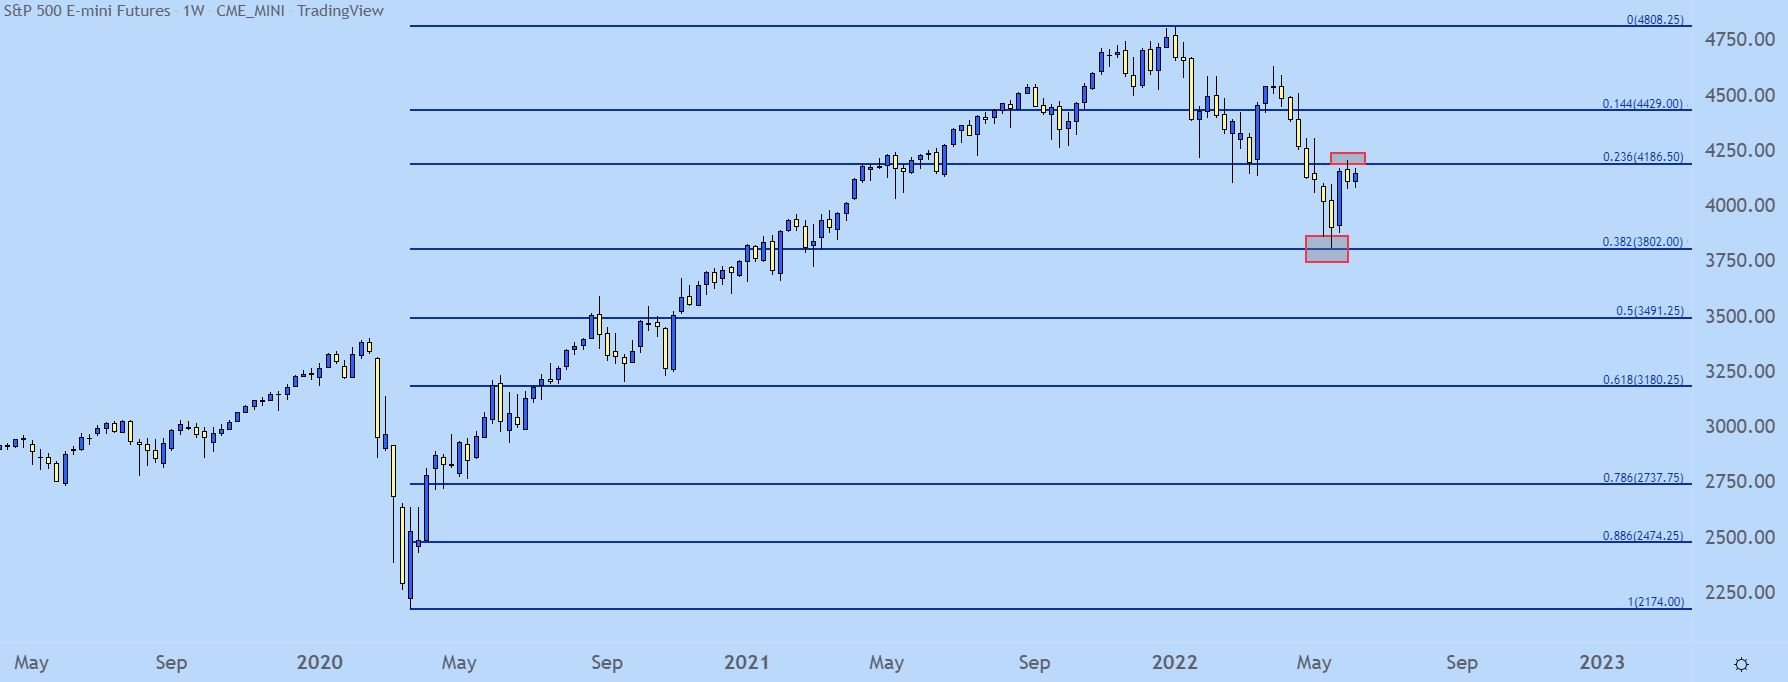
Chart prepared by James Stanley; S&P 500 on Tradingview
From a longer-term perspective, the above chart tells the story fairly well. There’s a possible bearish trend to work with, much as we’ve been tracking at DailyFX throughout this year and more to the point, through Q2 trade.
Shorter-term, however, is where the complications begin to arise. That resistance inflection began to show last Tuesday. Since then, prices have continued to range in a very consistent box. Box formations are key for breakout potential, as traders can look for price to break the range before looking to play a fresh breakout into a possibly new trend.
I’m tracking this box in the S&P 500 from support at the low of 4071 along with resistance in a zone running from 4186-4211.

S&P 500 Daily Price Chart

Chart prepared by James Stanley; S&P 500 on Tradingview
S&P 500: Tracking the Box v/s The Big Picture Trend
Trading a box is usually a fairly simple type of operation: Look for the break and play that directional move. This box, however, could be a bit more challenging when taken in terms of the bigger picture move.
Sellers have had ample opportunity to sell the S&P 500 after that resistance inflection. The Fed is on the calendar for next week and we all know that. We also know that the bank will likely be heavy-handed with warnings of future hikes, much along the lines of the Fed-speak that we’ve heard recently. And, with all of that sellers still haven’t taken their shot here and, instead, they’ve allowed for a range to build.
This can bring up the possibility of a break-and-fade scenario, where the box shows a topside break first, at which point reversal setups may soon become attractive again.
Such a scenario could remain attractive provided that price sticks below resistance of 4304 which helped to set the May monthly highs.
S&P 500 Four-Hour Price Chart
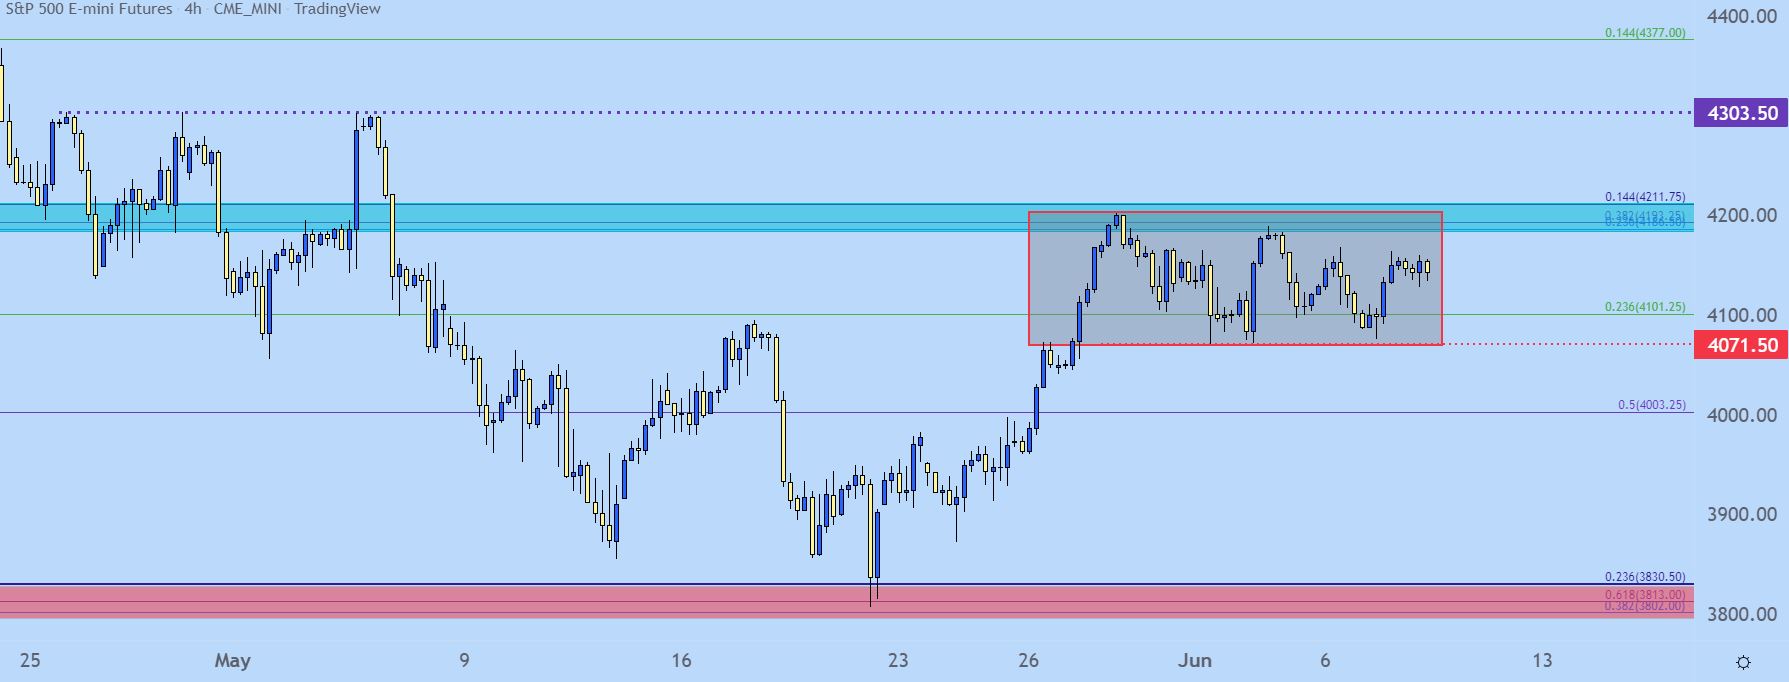
Chart prepared by James Stanley; S&P 500 on Tradingview
Nasdaq 100
I’m still more bearish in the Nasdaq 100, largely on the basis of effect should the Fed continue pushing the hawkish message. And, from a comparable basis, the Nasdaq has been more bearish than the S&P 500.
While the blue chip index above found support at the 38.2% retracement of the pandemic move, the Nasdaq 100 fell all the way down to the 50% marker of the same measured move.
And while current resistance in the S&P 500 is at the 23.6% retracement, the Nasdaq 100 is showing very similar resistance but at its own 38.2% marker. This highlights the additional pessimism that’s been priced-in to tech stocks of late.
Nasdaq 100 Weekly Price Chart
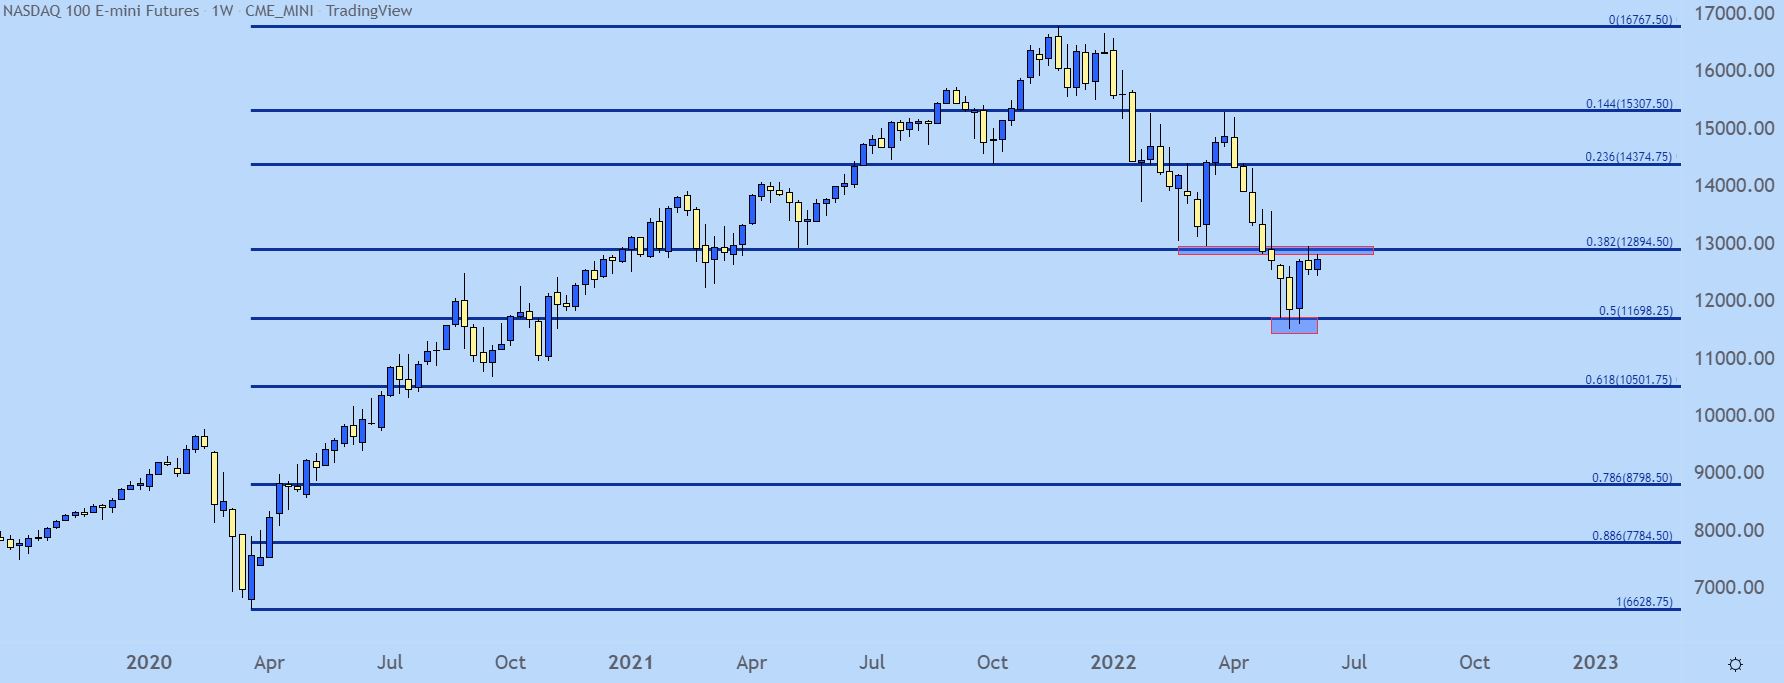
Chart prepared by James Stanley; Nasdaq 100 on Tradingview
Nasdaq 100 Box
On a shorter-term basis, we have a similar box that’s built in the Nasdaq 100. There was a test of support yesterday morning but sellers were unable to break much fresh ground there.
For resistance, I’m tracking a group of Fibonacci retracements in a confluent spot spanning from 12,894 up to 13,050. Invalidation of the bearish theme could be sought at another key spot around 13,712 as that was the area that helped to hold the early-May high.
For bearish scenarios, a poke above resistance that isn’t followed-through can start to open the door for fades. Or, a breach of box support around 12,412 can open the door for a trip down to bigger-picture support, plotted at around the 12k psychological level. And, if that price trades, the option of holding some of the remaining position open for continued breakout remains if looking for a print of fresh lows in the index.

Nasdaq 100 Daily Price Chart
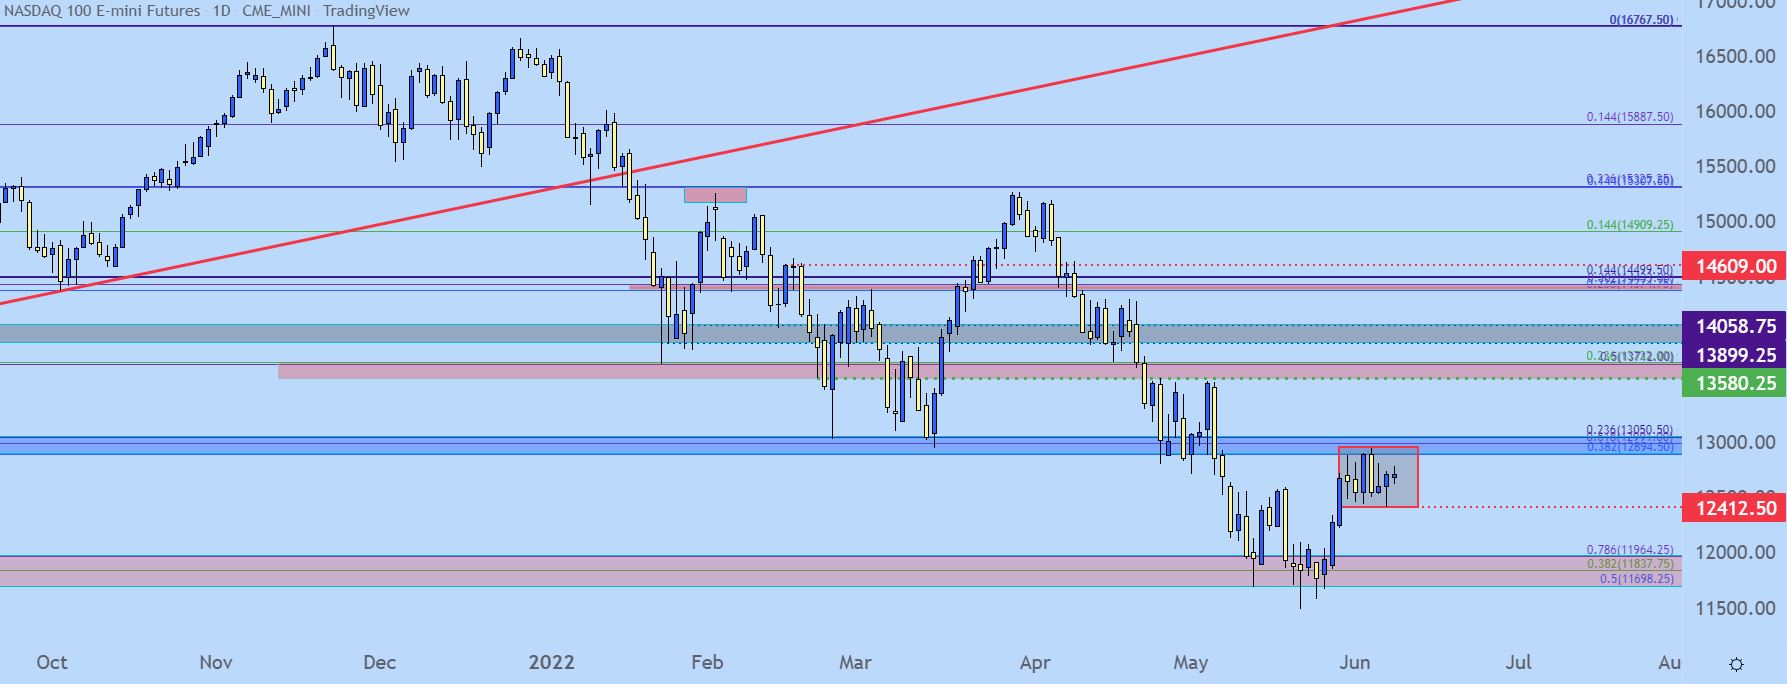
Chart prepared by James Stanley; Nasdaq 100 on Tradingview
--- Written by James Stanley, Senior Strategist for DailyFX.com
Contact and follow James on Twitter: @JStanleyFX


