


Stock Market Talking Points:
- SPY, IVV, and VOO shed capital during the S&P 500’s best quarter in nearly ten years
- Elsewhere, government debt ETFs saw demand that reflects the recent yield curve inversion
- Interested in equities and ETF fund flows? Sign up for the weekly webinar - Stock Market Catalysts for the Week Ahead
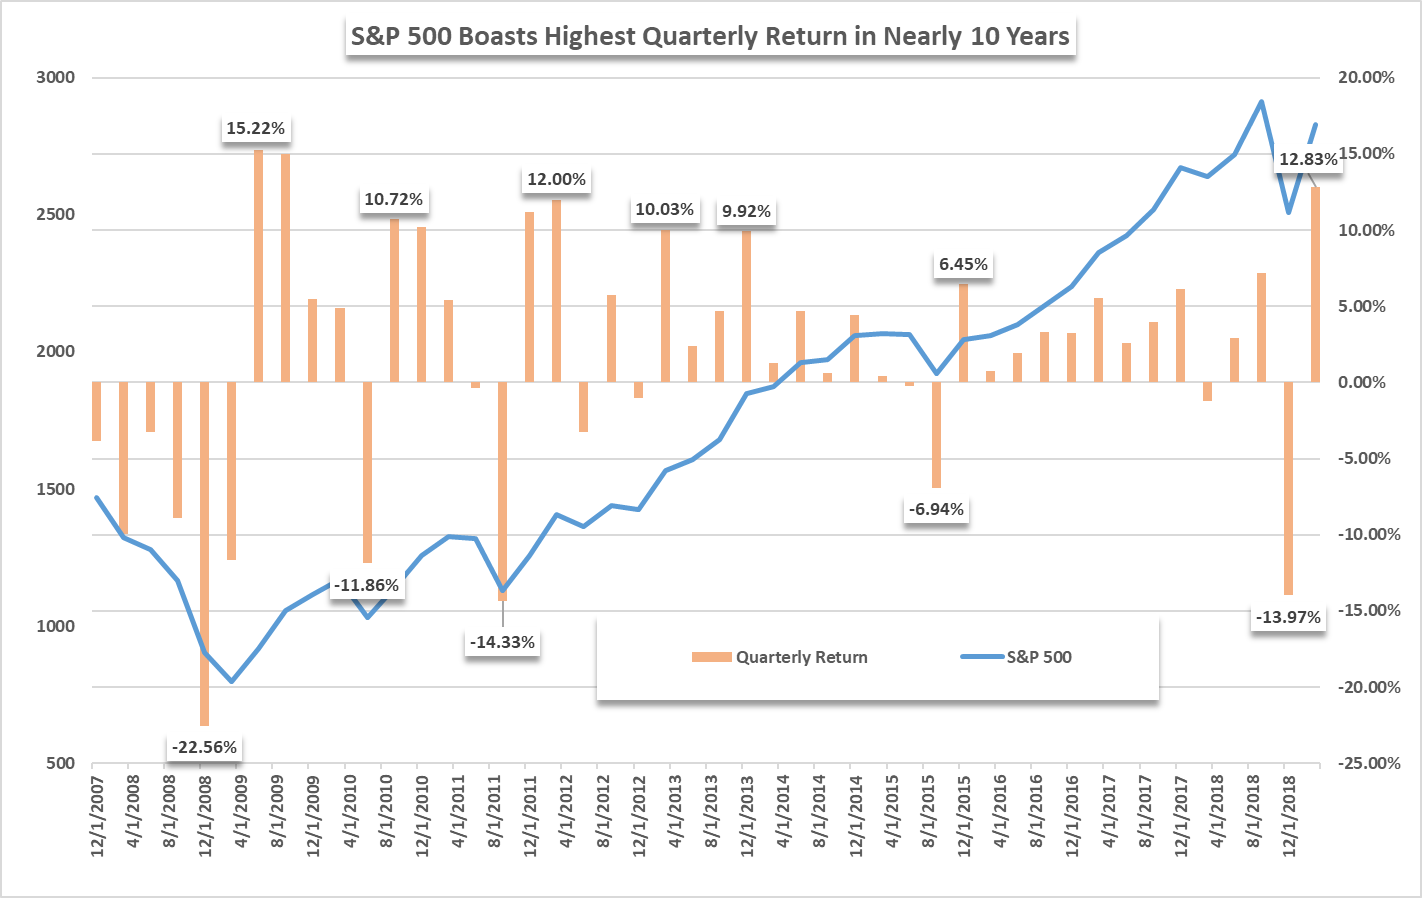
S&P 500: Best Q1 Since 1998 Despite ETF Outflows
The S&P 500 looks to cap off this week – and the first quarter – with a marginal increase from the prior session but large enough to solidify the best quarterly performance for the index since Q3, 2009 around 12.50%. Compared exclusively to other first quarters, Q1, 2019 offered the highest return since Q1, 1998.
S&P 500 Quarterly Returns (Chart 1)
Learn tips and tricks to day trading the S&P 500
Despite the stellar quarterly return, the aggregate fund flows from SPY, IVV and VOO recorded an outflow of $1.6 billion during the period, assisted by the largest intraday outflow for the funds ever. It is also worth noting that the majority of inflows were recorded in the second half of the quarter, specifically during March which saw $9.1 billion in inflows.
Aggregate Fund Flows of SPY, IVV and VOO ETFs (Chart 2)
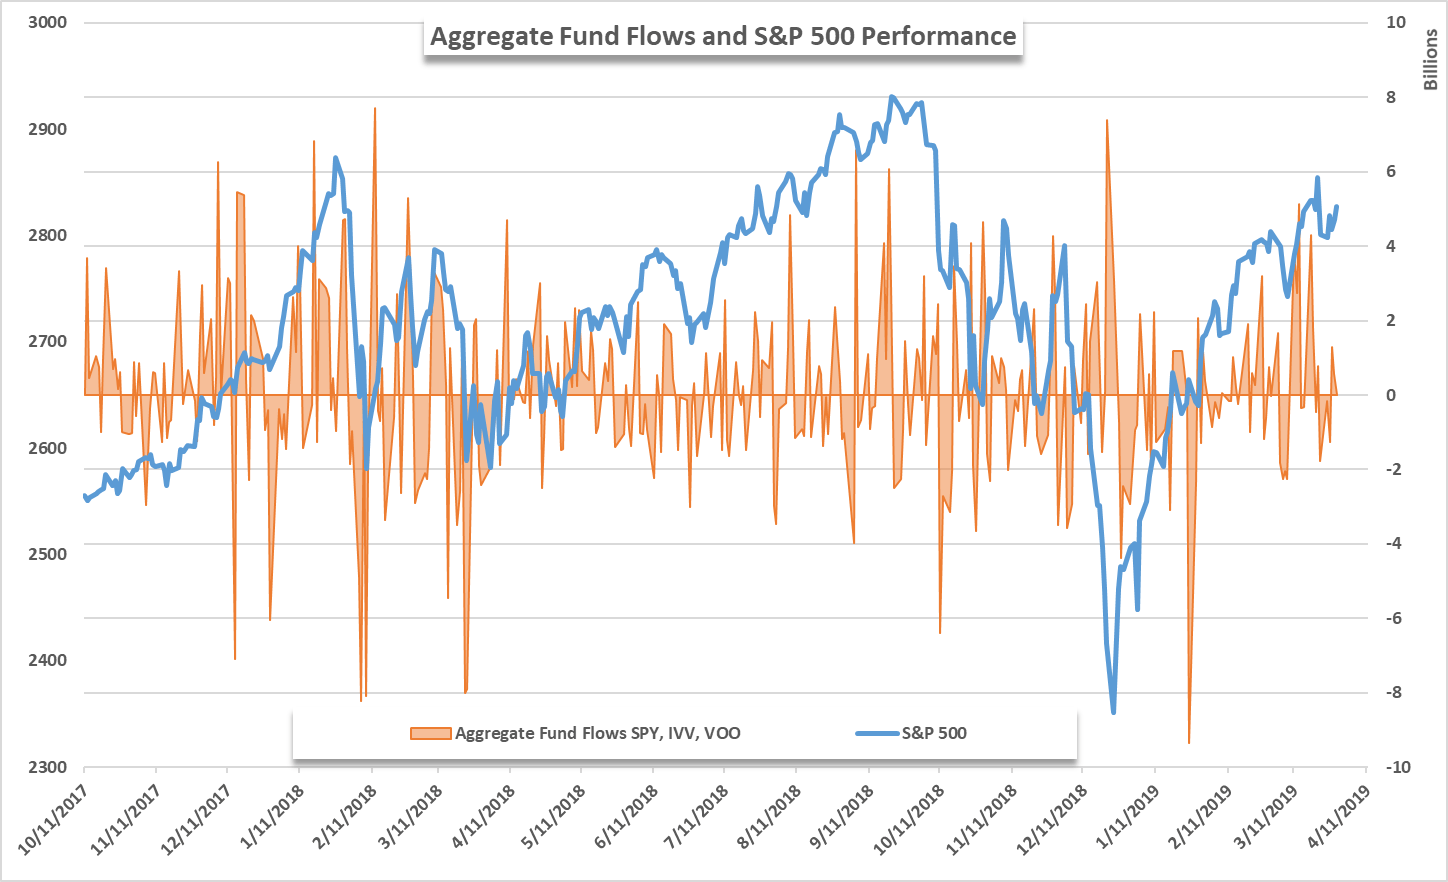
February saw $2.9 billion in net inflows while January notched a rather painful $13.6 billion in outflows following December’s rout. It appears many investors were hesitant to buy into the recovery rally until it was well underway.
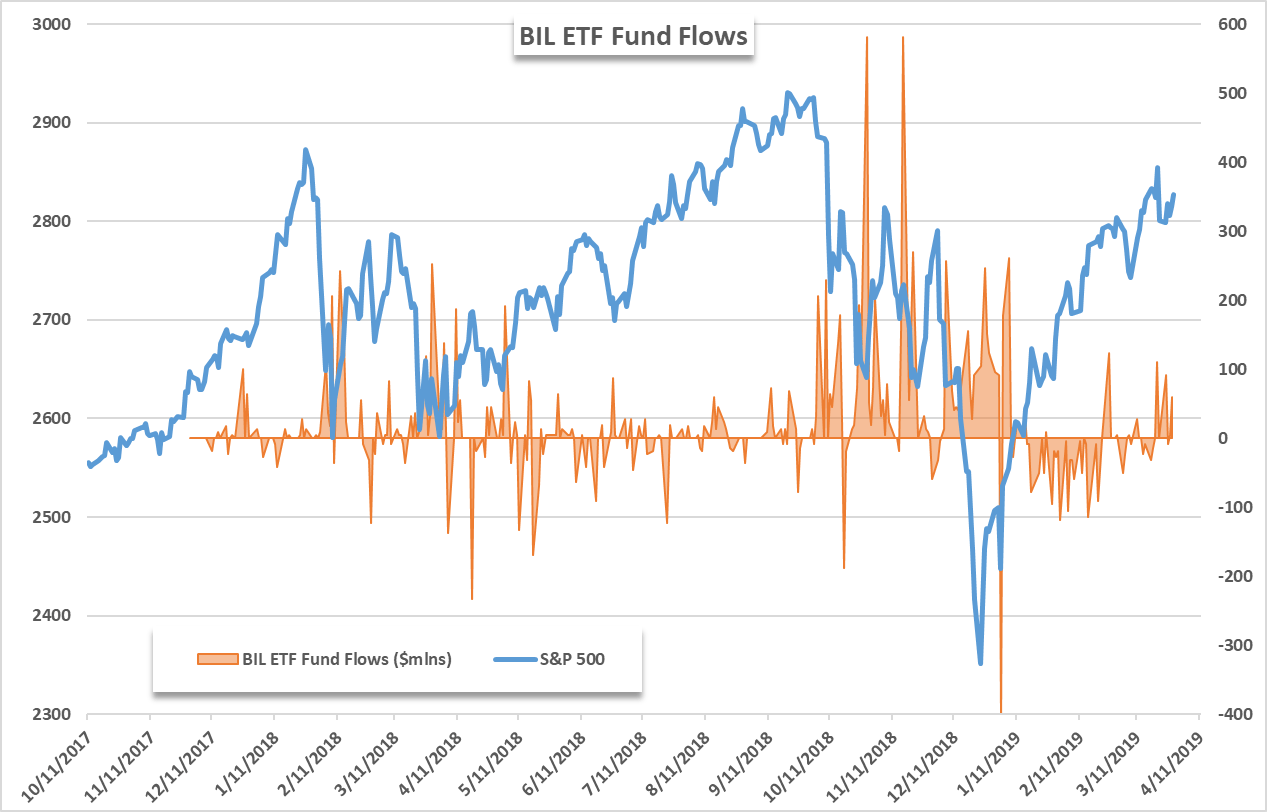
Exchange Traded Funds and the Yield Curve Inversion
Elsewhere, fund flows offered further evidence for the recent yield curve inversion. The BIL ETF – which grants exposure similar to that of 1-3 month treasury bills – saw $146 million in inflows this week. Interestingly, the fund recorded net outflows of $617 million for the quarter with consistent outflows during January and February.
BIL ETF Fund Flows (Chart 3)
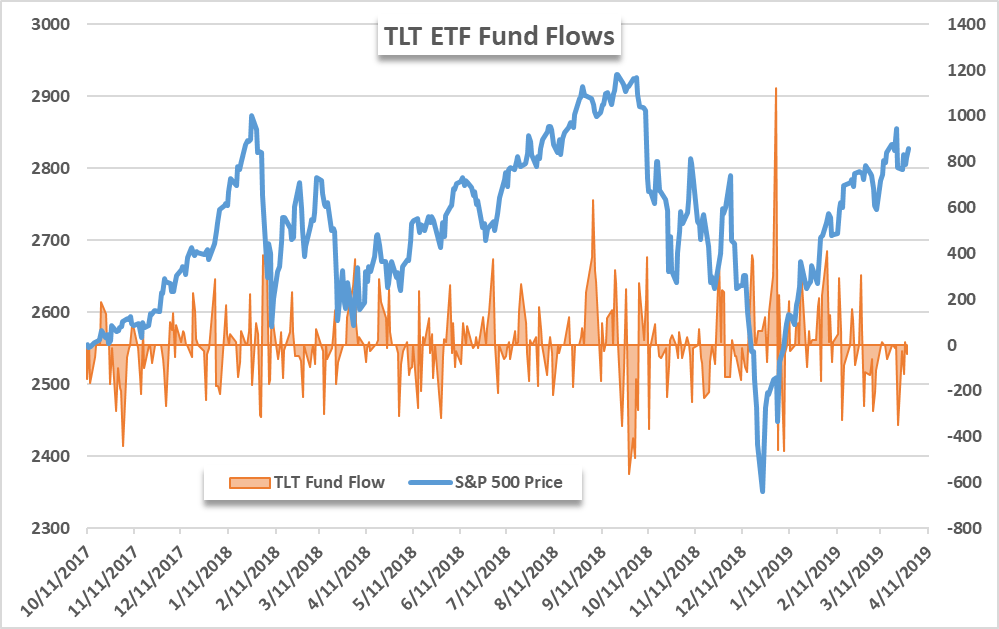
On the other hand, funds that grant exposure to longer-term treasuries recorded outflows this week as the yield curve inverts further. The TLT ETF saw net outflows reach $175 million for the week, nearly a perfect contrast to the inflows into BIL. For the quarter, TLT saw $775 million in fresh capital.
TLT ETF Fund Flows (Chart 4)
The contrasting performances potentially reflect the type of demand behind the flows throughout the quarter. In January - when investors were wrestling with the recent rout and seeking relative safety - both short and long-term government debt ETFs recorded inflows.
As the quarter progressed, shorter-term debt was cast aside while TLT saw continued demand amid global growth uncertainty and an uncertain outlook for the S&P 500. Since the March FOMC meeting, TLT has seen $536 million in outflows while BIL recorded $256 million in inflows, reflecting the lack of upside in exposure to longer-term debt as futures markets begin to price in a cut to the Federal Funds rate range in 2020 and uncertainty about the future grows.
As the record first quarter draws to a close, the outlook for the second is muddied with conflicting themes. Should the yield curve inversion strengthen, investors may continue the current trend in BIL and TLT. Elsewhere, the three broad-market tracking funds could witness deeper outflows as investors look to shift capital allocation out of the S&P 500 in its tenth year of a bull-run. That being said, relatively high correlations in other markets present ample trading opportunities in the coming quarter.
Read more: Will the Stock Market Crash in 2019?
--Written by Peter Hanks, Junior Analyst for DailyFX.com
Contact and follow Peter on Twitter @PeterHanksFX
DailyFX forecasts on a variety of currencies such as the US Dollar or the Euro are available from the DailyFX Trading Guides page. If you’re looking to improve your trading approach, check out Traits of Successful Traders. And if you’re looking for an introductory primer to the Forex market, check out our New to FX Guide.


