


Near-term Technical Outlook: Trade Setups on Gold, DXY & USD/CAD
- Updated charts on technicals setups we’ve been tracking in Gold, DXY & USD/CAD
- Gold breakout risks near-term exhaustion
- USD attempting to break critical resistance range at fresh yearly highs
- USD/CAD bulls eye confluent uptrend resistance
An update on technical setups we've been tracking inthe Gold, the US Dollar Index and the Canadian Dollar. These are the targets and invalidation levels that matter heading into the close of the week. Review my latest Strategy Webinar for an in-depth breakdown of thesetechnical setups and more.
Gold Price Chart - XAU/USD Daily
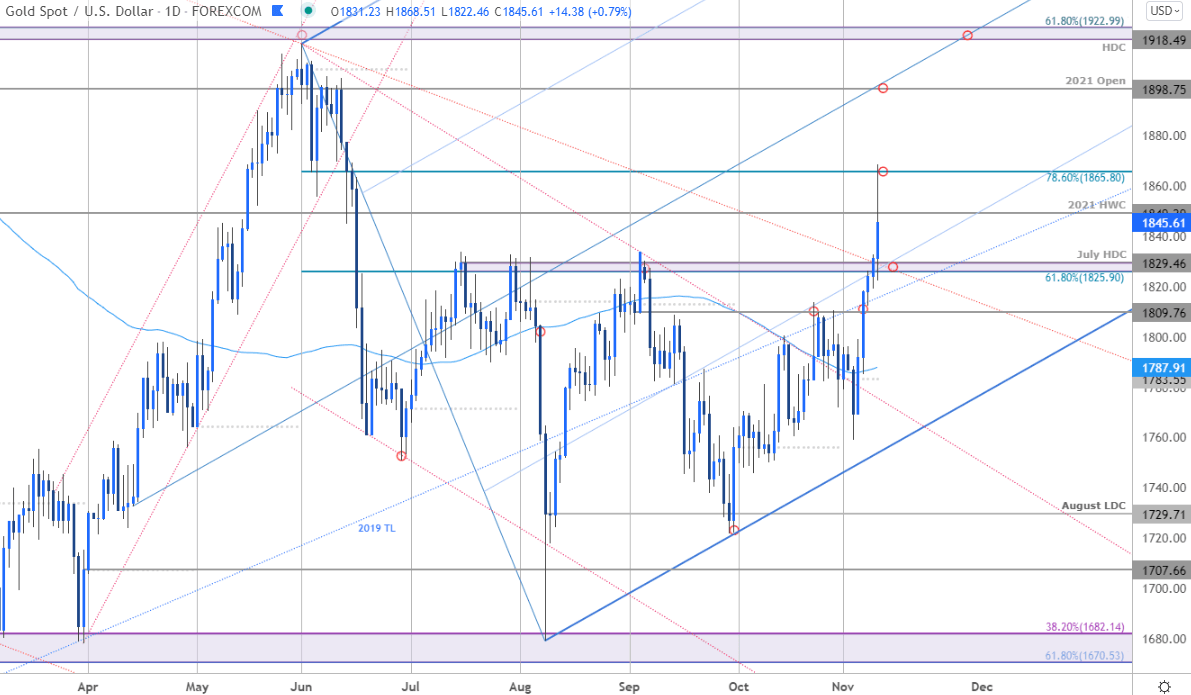
Chart Prepared by Michael Boutros, Technical Strategist; Gold on Tradingview
In my last Gold Price Outlook we noted that XAU/USD, “risks near-term exhaustion within the broader uptrend into the November open. From a trading standpoint, be on the lookout for a low ahead of the lower parallels with a topside breach / close above 1809 needed to fuel the next leg towards key resistance closer to 1830.” Gold registered a low at 1758 on November 3rd before reversing sharply higher with the subsequent rally ripping through topside targets into the 78.6% retracement of the yearly range at 1865.
Bottom line: The five-day advance risks topside exhaustion here. Look for support ahead of 1825/30 IF price is indeed heading higher with a breach of the highs keeping the focus on the objective yearly open at 1898. Review my latest Gold Weekly Price Outlook for a look at the longer-term XAU/USD technical trade levels.
Gold Trader Sentiment – XAU/USD Price Chart
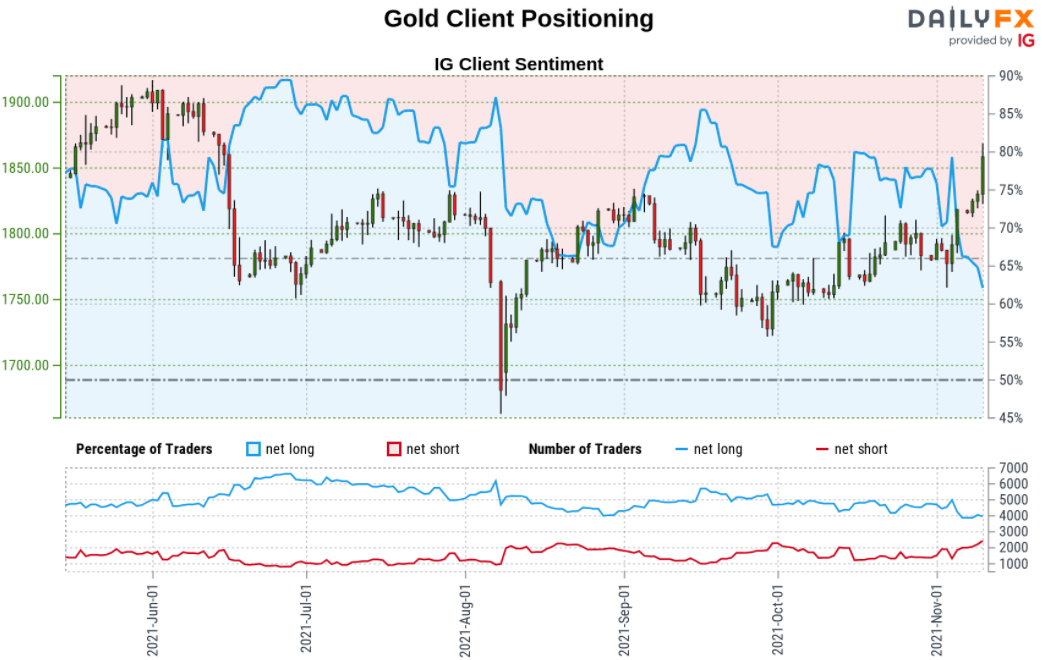
- A summary of IG Client Sentiment shows traders are net-long Gold- the ratio stands at +1.87 (65.10% of traders are long) – typically weak bearishreading
- Long positions are3.82% lower than yesterday and 21.50% lower from last week
- Short positions are 11.85% lower than yesterday and 40.27% higher from last week
- We typically take a contrarian view to crowd sentiment, and the fact traders are net-long suggests Gold prices may continue to fall. Traders are more net-long than yesterday but less net-long from last week. The combination of current positioning and recent changes gives us a further mixed Gold trading bias from a sentiment standpoint.
| Change in | Longs | Shorts | OI |
| Daily | 1% | -3% | -1% |
| Weekly | 2% | -8% | -2% |
US Dollar Index Price Chart – DXY Daily

Chart Prepared by Michael Boutros, Technical Strategist; US Dollar Index on Tradingview
In my latest US Dollar Weekly Technical Forecast we noted that the DXY, “rally is once again testing major slope resistance and we’re looking for a reaction here into the close of the week.” The zone in focus was 94.47/65- a region defined by the 38.2% Fibonacci retracement of the 2020 decline and the March 2020 low. Price is attempting to close above this threshold today and we’re looking for a weekly close above to validate a larger breakout towards the 2020 March low-day close at 95.06 and the 2019 low-day close at 95.55. Look for support back at the median-line with broader bullish invalidation now raised to the monthly opening-range low at 93.81.
Bottom line: The US Dollar is threatening a major breakout here and a weekly close above 94.47/65 is needed to keep the immediate long-bias viable towards the upper parallels. Review my latest US Dollar Price Outlook for a closer look at the near-term DXY technical trading levels.
Canadian Dollar Price Chart - USD/CAD Daily
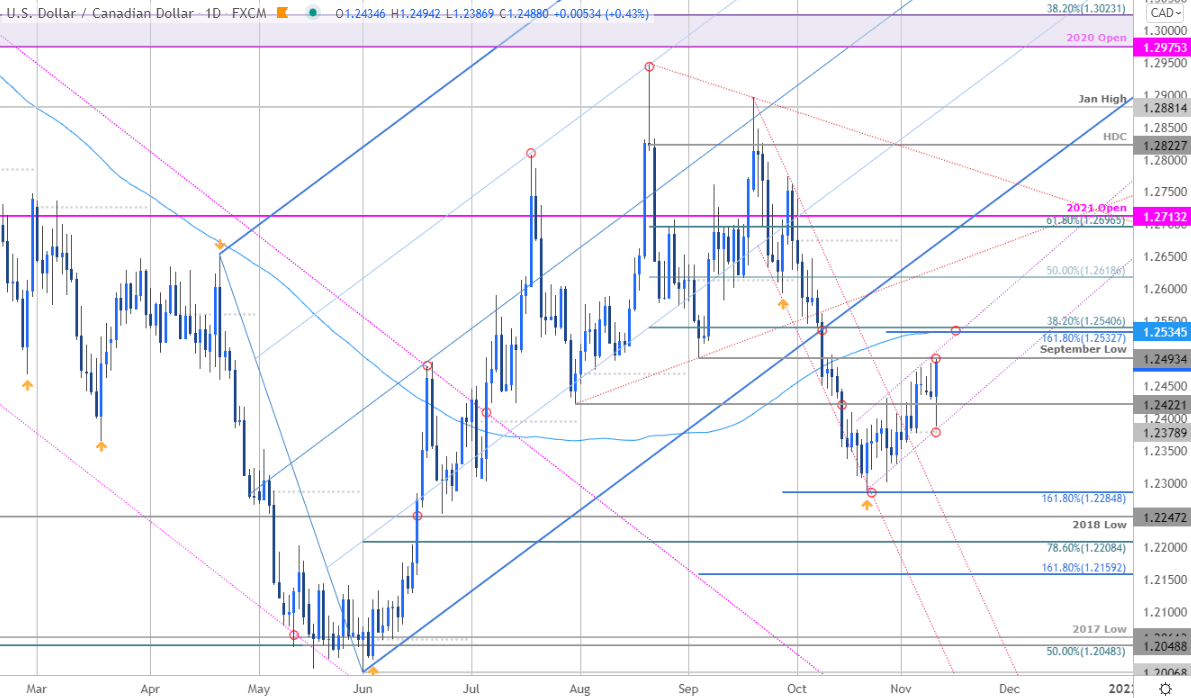
Chart Prepared by Michael Boutros, Technical Strategist; USD/CAD on Tradingview
In this week’s Canadian Dollar Technical Price Outlook we noted to be on the lookout, “for a breakout of the weekly opening-range for guidance here. Ultimately a move lower may offer more favorable opportunities with a daily close above 1.2520 needed to fuel the next leg higher in price.” USD/CAD plummeted early in the session to register an intraday low at 1.2387 before reversing sharply higher on the heels of today’s US inflation report. The rally is poised to mark a massive outside-day reversal off channel support with the advance now testing initial resistance at the September lows at 1.2493.
Bottom line: USDCAD is testing confluent resistance here at 1.2493- form a trading standpoint, looking for possible price inflection here. A close above this threshold is needed to mark resumption towards a more significant resistance confluence at the 1.618% extension / 38.2% retracement / 100-day moving average at 1.2532/40- look for a larger reaction there IF reached. Losses should be limited to 1.2422 IF this interpretation is correct. Review my latest Canadian Dollar Weekly Price Outlook for a look at the longer-term Loonie technical trade levels.

Canadian Dollar Trader Sentiment – USD/CAD Price Chart

- A summary of IG Client Sentiment shows traders are net-long USD/CAD - the ratio stands at +2.36 (70.26% of traders are long) – typically bearish reading
- Long positions are6.99% lower than yesterday and 9.95% lower from last week
- Short positions are unchanged than yesterday and 16.06% higher from last week
- We typically take a contrarian view to crowd sentiment, and the fact traders are net-long suggests USD/CAD prices may continue to fall. Yet traders are less net-long than yesterday and compared with last week. Recent changes in sentiment warn that the current USD/CAD price trend may soon reverse higher despite the fact traders remain net-long.
| Change in | Longs | Shorts | OI |
| Daily | -2% | 7% | 5% |
| Weekly | -30% | 38% | 13% |
For a complete breakdown of Michael’s trading strategy, review his Foundations of Technical Analysis series on Building a Trading Strategy
-Written by Michael Boutros, Currency Strategist with DailyFX
Follow Michaelon Twitter @MBForex


