


Stochastics in a Trading Strategy
Technical indicators are tools, that’s pretty much it. Most indicators are using past price information in a formula to arrive at a value, and that value can then be determined to be indicative of something.
As we looked at in our introduction on stochastics, the stochastic oscillator is an indicator that focuses on momentum. When momentum rises, so does the %K line. And given that the %D line is a moving average of %K, the simple crossover is indicative of shifting momentum. But as an oscillator, it’s values are bound between 0 and 100 and this also offers an element of overbought/oversold identification into the scenario, which can be helpful if applied properly.
Introduction to Technical Analysis
Technical Analysis Tools
Recommended by James Stanley
Stochastics is Not a Holy Grail
Before we get into strategy parameters the first thing to point out is something you likely (and hopefully) already know. No indicator is going to be ‘perfect.’ No indicator is going to show you proper entries and exits for every situation. After all, stochastics or any other indicator is just a tool, really. And tools are helpful, too; but you probably wouldn’t go and pick up a hammer and expect that it’ll tell you the future – because it’s a hammer.
Stochastics are the same. It’s a tool, and can be helpful in the right situation. But, expecting the indicator to constantly highlight great trading setups is a recipe for disaster because at the end of the day, any indicator is just a tool, like a hammer.
Where Does Stochastics Fit?
Because stochastics highlights shifting momentum, it can be an ideal trigger in a traders strategy, helping to enter into positions once other criteria is met. That other criteria is often going to be related to trend diagnoses or major support and resistance levels coming into play, after which the trader looks for a shift in trend.
Stochastic Strategy Example
A simple way of setting up such a strategy is by applying a trend filter, like a moving average, to give the trader a bias for directional moves. So if prices are above the moving average, the trader is looking for long positions in order to trade in the direction of the trend. The stochastic bullish crossover can be incorporated as the trigger for those long positions, again on the basis of price being above the moving average.

The trader can then apply stops to the position based on their method of choosing, and then look to exit on the counter-signal, or the bearish crossover via stochastics. A short would not be entered if price is above the moving average because, again, the trend is designated as being ‘bullish’ and the trader would only be looking to trigger into bullish positions in the direction of the trend. And in that situation, once a corresponding indication was generated by stochastics, a position could be taken on. The below chart illustrates how this strategy could look using a daily chart in GBP/USD using a 100 day moving average as a trend filter.
To explain the below chart, on the left side prices are above the moving average, meaning the strategy would be looking for long positions only, and this would be triggered on a bullish indication via stochastics. The bearish signal would negate the bullish signal, so that can be looked to for a possible exit point from the position. The active areas for the strategy are represented by colored boxes, blue for bullish signals and red for bearish signals, which dominate the right side of the chart.
Notice, however, that not every signal leads to a directional run. The future is constantly unpredictable and no indicator is going to constantly be right because, again, it’s a simple tool. But simple tools can accomplish complex jobs, and the strategy below is a start towards that end.
GBPUSD Daily Chart
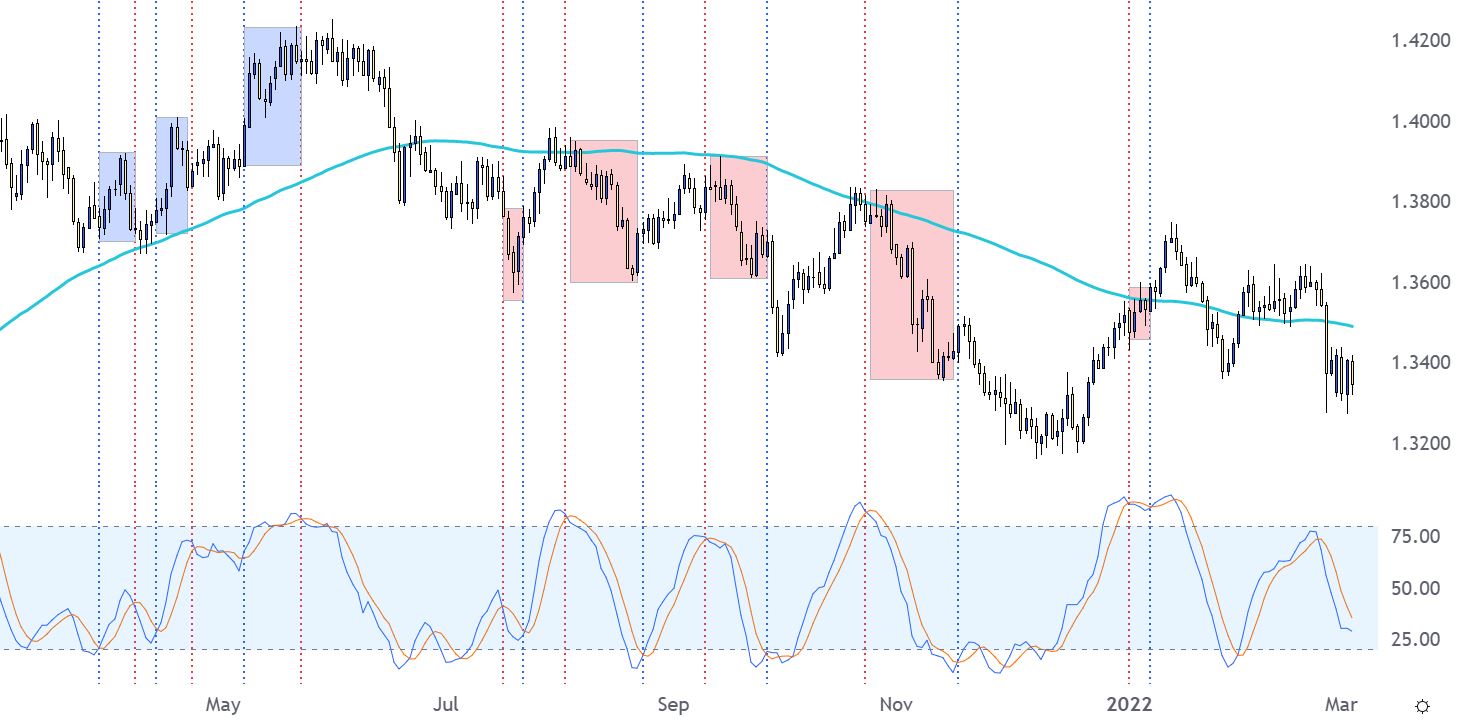
Created by James Stanley, GBP/USD Daily Chart, April 2021-March 2022

--- Written by James Stanley, Senior Strategist for DailyFX.com
Contact and follow James on Twitter: @JStanleyFX