


The stochastic oscillator is a useful indicator when it comes to assessing momentum or trend strength. The stochastic oscillator, and oscillators in general, are presented in an easy to understand manner with clear buy and sell signals. However, an overreliance on these signals, without a deeper understanding of stochastic oscillators, is likely to end in frustration.
To avoid such frustration, new traders ought to have a solid understanding of the underlying mechanics of the stochastic oscillator viewed in relation to present market conditions.
What is a Stochastic Oscillator?
A stochastic oscillator is a momentum indicator that calculates whether the price of a security is overbought or oversold when compared to price movement over a specified period. The oscillator essentially weighs up the most recent price level as a percentage of the range (highest high – lowest low) over a defined period of time.

How does a Stochastic Oscillator Work?
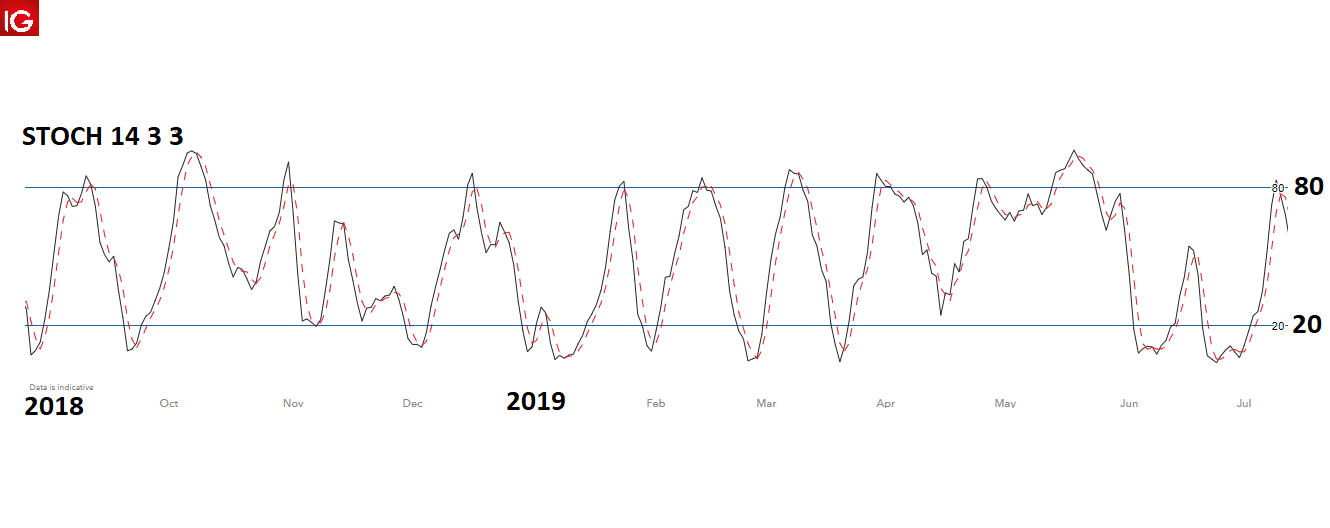
The stochastic oscillator presents two moving lines that ‘oscillate’ between two horizontal lines. The solid black line in the image below is called the %K and is determined by a specific formula (explained later in the article), while the red dotted line is a 3-period moving average of the %K line.
Price is shown to be ‘overbought’ when the two moving lines break above the upper horizontal line and ‘oversold’ once they break below the lower horizontal line.
The overbought line represents price levels that fit into the top 80% of the recent price range (high – low) over a defined period – with the default period often being ‘14’. Likewise, the oversold line represents price levels that fit into the bottom 20% of the recent price range.
Timing entries
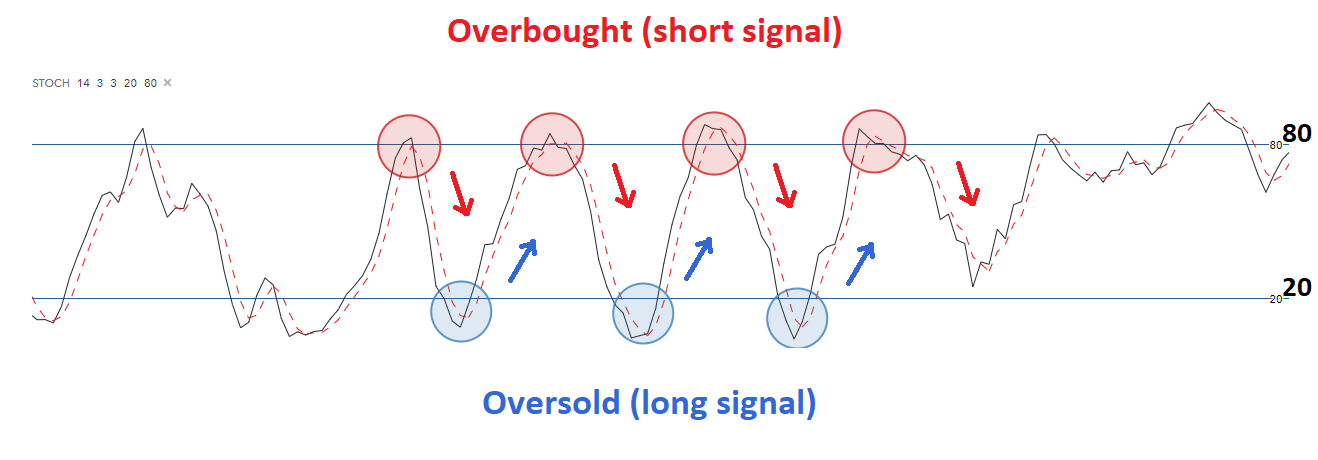
Furthermore, the stochastic indicator provides great insight when timing entries. When both lines are above the ‘overbought’ line (80) and the %K line crosses below the dotted %D line, this is viewed as a possible entry signal to go short and visa versa when the %K line crosses above the %D line when both lines are below the oversold line (20).
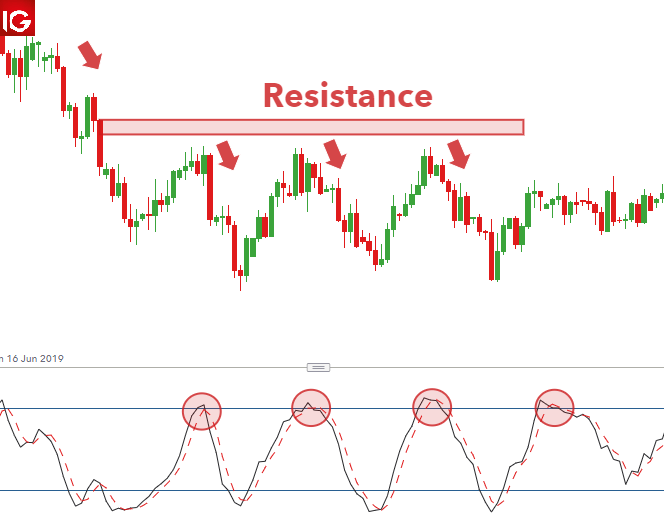
Additionally, traders should not blindly trade based on overbought/oversold conditions alone. Traders need to understand the direction of the overall trend and filter trades accordingly. For example, when looking at the USD/SGD chart below, since the overall trend is down, traders should only look for short entry signals at overbought levels. Only when the trend reverses or a trading range is well-established, should traders look for long entries in oversold conditions.

Stochastic Oscillator Formula
The below calculation is presented for a 14-period stochastic indicator but ultimately, can be tailored to any desired time frame.
Calculation for %K:
%K = [(C – L14) / H14 -L14)] x 100
Where:
C = latest closing price
L14 = Lowest low over the period
H14 = Highest high over the period
Calculation for %D:
%D = simple moving average of %K (3 period simple moving average is the most common)
Pros and Cons of Stochastic Oscillators
Traders ought to understand where the stochastic oscillator excels and where its short-comings lie, in order to get the most out of the indicator.
| Pros | Cons |
|---|---|
| Clear entry/exit signals | Can produce false signals when used incorrectly |
| Signals appear frequently (depending on the selected time setting) | If trading against the trend, prices can remain overbought/oversold for long periods |
| Available on most charting packages | |
| Conceptually easy to understand |
Stochastic Oscillators: A Summary
The stochastic indicator is a great tool for identifying overbought and oversold conditions over a specific time period. The stochastic oscillator is preferred by many traders when price is trading in a range because price itself is ‘oscillating’, leading to more reliable signals from the stochastic indicator. However, traders need to avoid blindly shorting at overbought levels in upward trending markets; and going long in down trending markets purely based on oversold conditions shown by the indicator.
Become a Better Trader with Our Trading Tips
- If you are just starting out on your trading journey it is essential to understand the basics of forex trading in our free New to Forex trading guide.
- Another oscillator indicator that shows overbought and oversold regions is the Relative Strength Index (RSI). However, the RSI is very different to the stochastic indicator which is why traders need to understand the formula and what the indicator communicates about price.
- Commodity Channel Index (CCI), although its name refers to commodities, is an indicator that can be used in forex trading too. It tends to oscillate between a reading of +100 and -100 but unlike the stochastic indicator, uses statistical variation from the mean to produce signals.