


Japanese Yen, USDJPY, EURJPY and NZDJPY Technical Forecast Talking Points:
- USDJPY has made for one of the most productive charges to peak highs in 2022 and also offers up the most progressive turns – but the trend is not guaranteed
- While EURJPY’s general correlation to the USDJPY is positive, this pair looks more capable of breaking either higher – to hold the larger bull trend – or lower
- Among the major Yen crosses, NZDJPY presents the most provocative bullish charts of the crosses as it enters the week already in the 88.00 – 87.25 resistance zone

Technical Forecast for the Japanese Yen: Bullish
The Japanese Yen put in for its biggest retreat (USDJPY its biggest rally) in 7 weeks this past this past period. The 1.7 percent charge is significant, but it likely draws more on the elevated volatility of the past few months – with primarily bearish intonations – than reflecting genuine intent. That is furthered by the recognition that the bulk of the move happened on Monday with a quick taper in activity through the rest of the week. Looking at the period ahead, there is a high probability of volatility drawing on event risk like Tuesday’s US CPI release and Wednesday’s FOMC rate decision. That said, expectations will also project a rapid decline in liquidity after the week closes and we move into the final weeks of the 2023 – during the ‘holiday conditions’. USDJPY is working with a range of 137.50 to 133.75 which is fairly wide for this cross. To the upside we have former support as new resistance and the 20-day simple moving average (SMA) which is the next structural ceiling to any progressive bear markets. Lower, the floor is more open to interpretation. The 200-day SMA has moved up to the same level as the previous major swing high back in January 2002 at 135.00/25 while the 38.2 percent Fib retracement of the 2022 range is at 133.20. Before breaking either of these barriers, we first need to get to the borders.
| Change in | Longs | Shorts | OI |
| Daily | -2% | 2% | 0% |
| Weekly | 12% | -16% | -6% |
Chart of USDJPY with 20 and 200-Day SMAs (Daily)
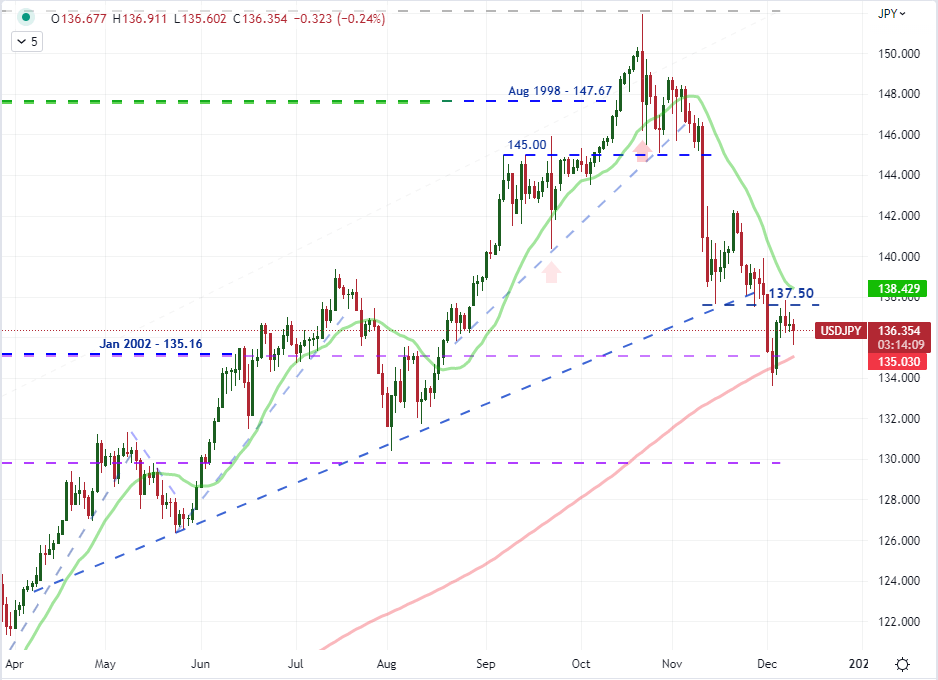
Chart Created on Tradingview Platform
The overall technical structure for USDJPY looks like it can readily progress into a larger bear trend, but not all Yen crosses are so clean. In fact, the run up we saw from that benchmark pair and the subsequent turn is fairly unique among these pairings. Looking at the second most liquid of the crosses, there is more balance in how it could be perceived to eventually break. While there has been a general bearish trend these past few months, it has not been as productive and certainly hasn’t traded technical floors as new ceilings like USDJPY. Nevertheless, there is a channel to be drawn from the progress, which could make a bullish break (above 144.50) a serious pattern disruptor that could support chop until we return to either the October swing high or the larger channel floor. Speaking of that larger channel, it doesn’t have many points of test; but the three major swing lows through the year does confirm for me. Trendlines can be somewhat ambiguous though, so I will look for any breach to also drawn on the August-October bull leg midpoint at 144.75 if there is confirmation.
| Change in | Longs | Shorts | OI |
| Daily | -9% | 0% | -3% |
| Weekly | 17% | -22% | -11% |
Chart of EURJPY with 200-Day SMA (Daily)
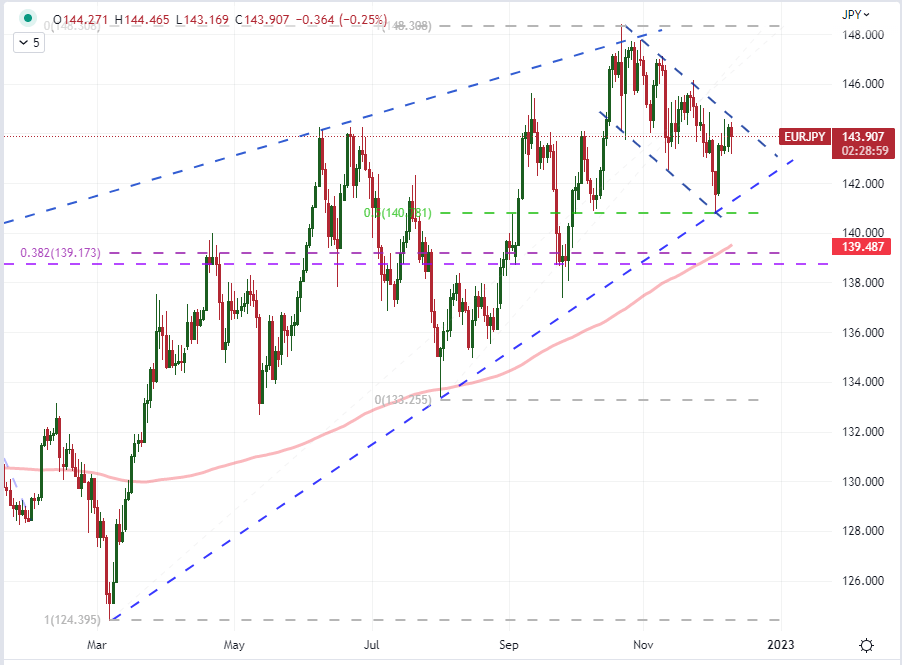
Chart Created on Tradingview Platform
Where USDJPY looks to be among the most productive bearish pictures among the Yen crosses and EURJPY can be evaluated either way, the NZDJPY is arguably the most bullish picture amongst its peers. We closed out this past week with a fifth consecutive day’s rally to close out the week essentially in line (on a close over close basis) with the seven year high back on September 12th. It is fair to say that we are at the very cusp of resistance on a rising triangle pattern that stretches back to April. With a fundamental spark such as a general rally in risk-leaning assets (which could benefit carry trades), a breach above 88 would not be difficult to achieve. Then again, attempting to charge a new leg higher into the twilight of liquidity for the year is a tall task. The past of least resistance would be a break lower, instigated by the more acute rising triangle support from the October swing low. That would put a bearish break more in the 86 region – rather than down near 82 on the 2022 pattern.
Chart of NZDJPY with 100 and 200-Day SMAs, 20-Day ATR (Daily)
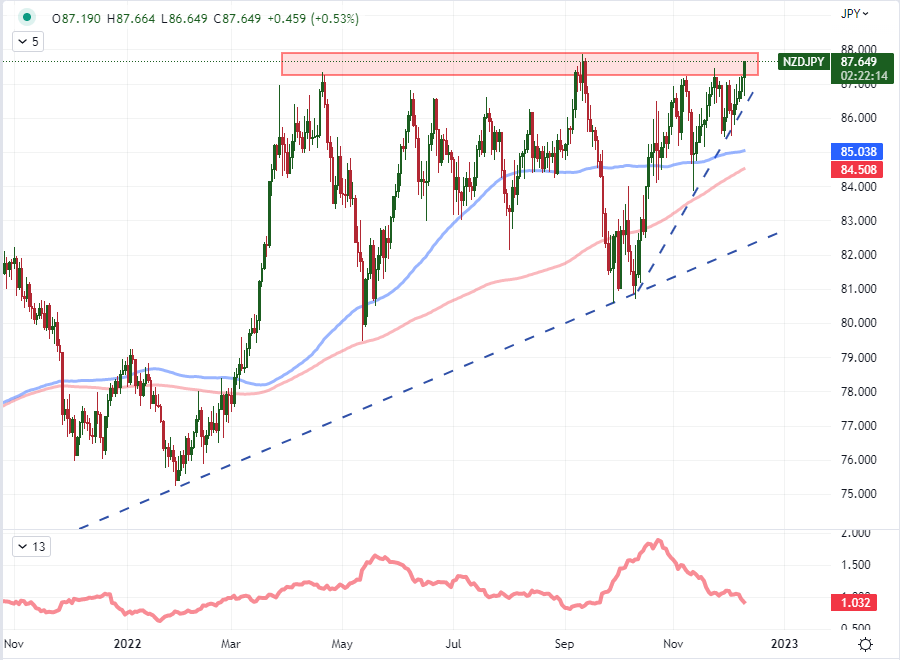
Chart Created on Tradingview Platform


