


S&P 500, SPX, NASDAQ 100, NDX - TECHNICAL OUTLOOK:
- US equities’ technical posture continues to improve.
- The S&P 500 and the Nasdaq 100 index look set to rise toward their respective August highs.
- What are the key levels to watch?

US equity indices’ jump on Wednesday after the US Federal Reserve’s interest rate decision further confirmsthe bullish outlook highlighted in the weekly forecast last weekend.
The Fed hiked interest rates by 25 basis points to 4.5%-4.75%, in line with expectations, and said “ongoing increases” to rates would be appropriate. However, the US central bank acknowledged that inflation has eased. “We can now say for the first time that the disinflationary process has started,” Fed Chair Jerome Powell told reporters, boosting hopes that the Fed is nearing the end of the current rate hiking cycle. The futures market continues to price in rate cuts this year with the fed funds rate seen below 4.50% by the end of December.
S&P 500 INDEX TECHNICAL OUTLOOK – BULLISH
The S&P 500 closed on Wednesday above crucial resistance at the early-December high of 4100, reasserting the bullish bias. This follows a rise above another vital barrier on the 200-day moving average and a rebound from quite a strong cushion around the Ichimoku cloud support on the daily chart.
S&P 500 Daily Chart
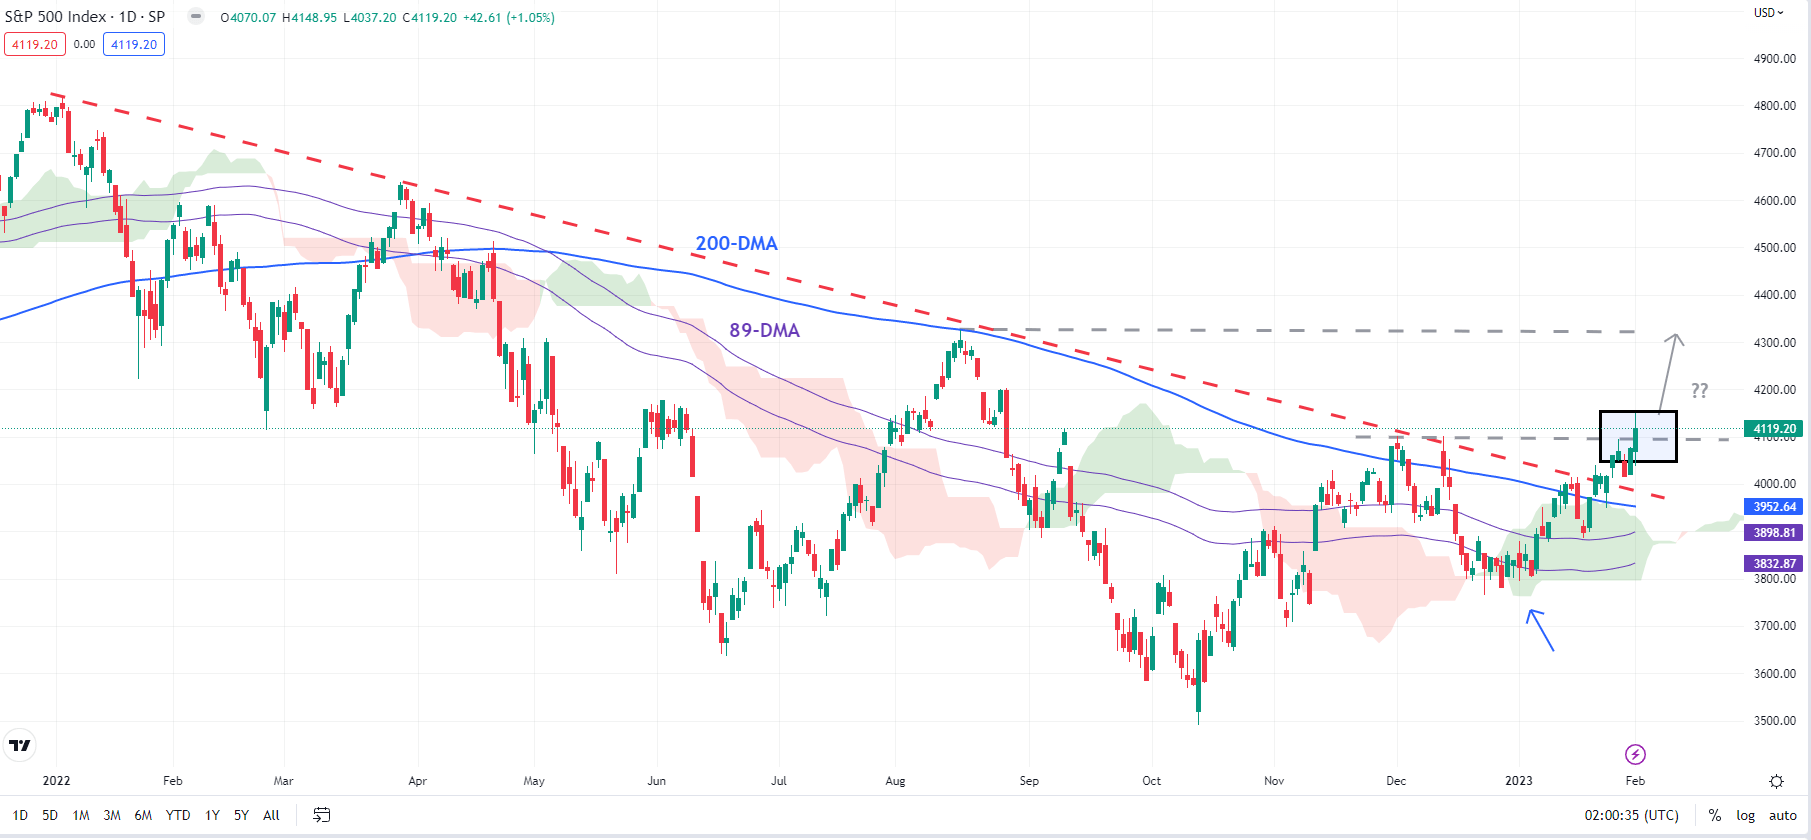
Chart Created Using TradingView
While the upward momentum has improved recently, one closer above Wednesday’s high would cement the view that the index had formed an important base. Moreover, the European Central Bank and the Bank of England interest rate decisions today and US jobs data on Friday could provide further cues.
A decisive close (2 daily closing highs) would establish the higher-highs-higher-lows sequence for the first time since January 2022. Such a break could pave the way toward the August high of 4325. It would also present an opportunity to revisitthe Q1-23 outlookin light of the recent chart developments.
NASDAQ 100 Daily Chart
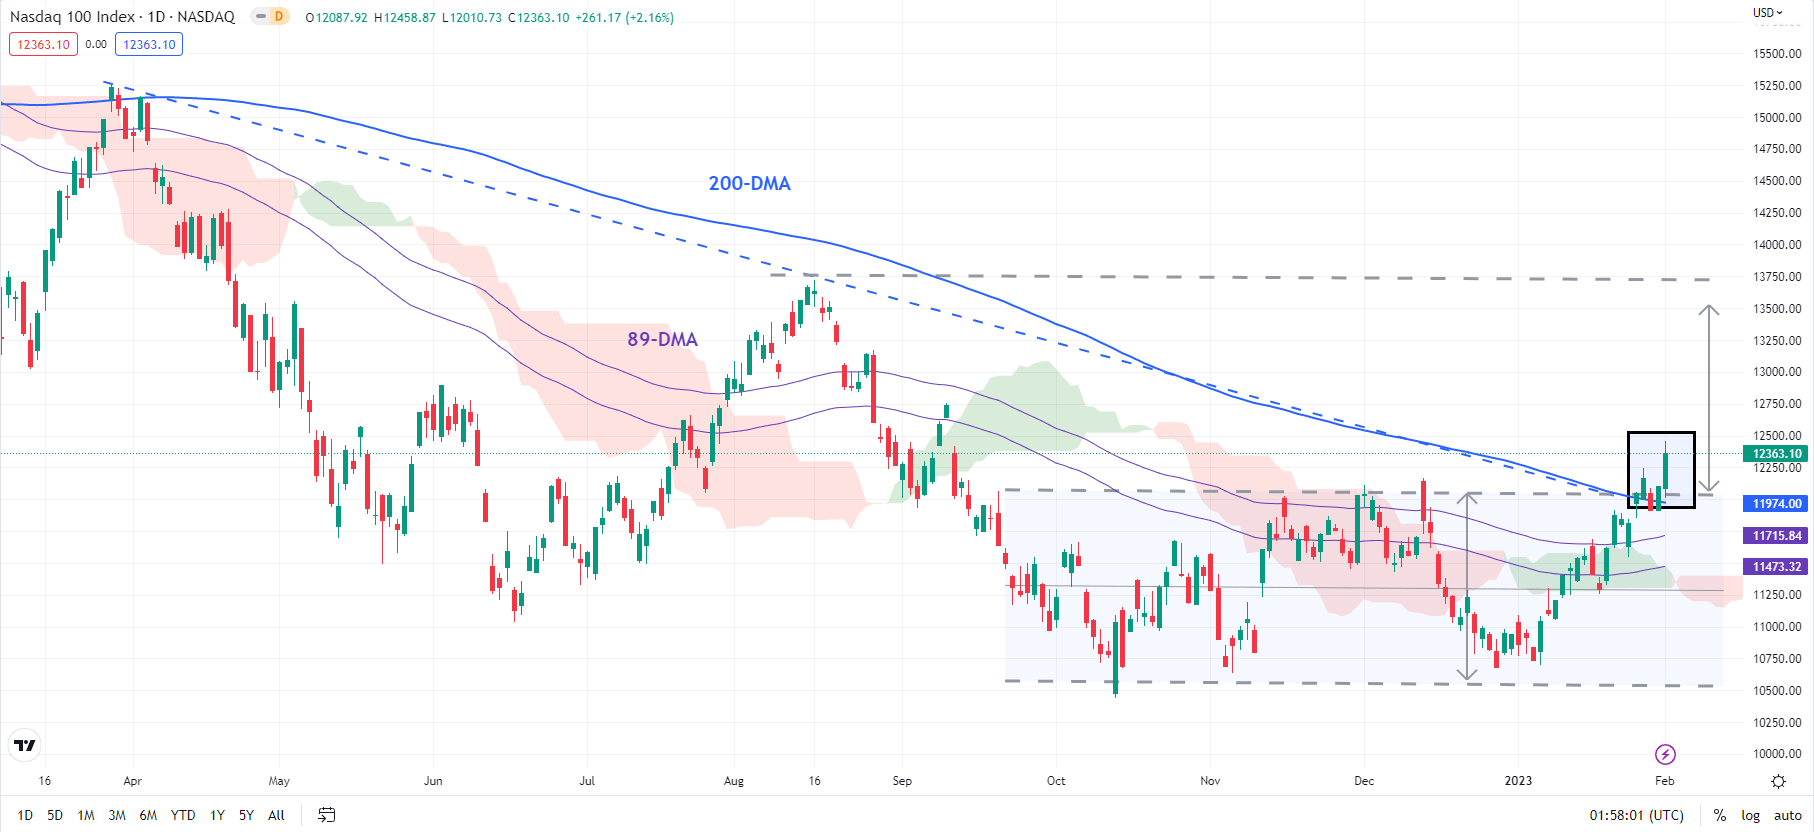
Chart Created Using TradingView
NASDAQ 100 INDEX TECHNICAL OUTLOOK – BULLISH
The Nasdaq 100 index, which wrapped the best January performance in 20 years, on Wednesday rose above stiff converged hurdle, including the December high of 12166 and the 200-day moving average. This is the first time the index has risen above the multi-week average since January 2022, raising the prospect of a more sustained bounce relative to the corrective rallies in 2022.
However, given the events risks and key US data due tomorrow, it might be prudent to wait for one more close higher. Such a move would raise the odds of a rise toward the August high of 13720 as it would trigger a bullish break from the sideways channel since the end of 2022. Furthermore, if the Nasdaq 100 index manages to close this week above 12166 then it would also imply that the base around the 200-week moving average had been set.

--- Written by Manish Jaradi, Strategist for DailyFX.com


