


S&P 500, SPX, NASDAQ 100, NDX - TECHNICAL OUTLOOK:
- US equities are gearing up for a break higher.
- The S&P 500 and the Nasdaq 100 index look set to rise toward their respective August highs.
- What are the key levels to watch?

Developments on the charts suggest US equity indices could be preparing for a break higher, raising the prospect that the worst could be over for now.
S&P 500 INDEX TECHNICAL OUTLOOK – BULLISH
The S&P 500 index is attempting to break above a crucial converged barrier: the 200-day moving average, coinciding with the early-December high of 4100. As noted in the previous update, a decisive break above the 200-day moving average barrier would be significant as it would be the first such break since the downtrend began a year ago and would support the case that US equities are attempting to form an important base.
S&P 500 Daily Chart
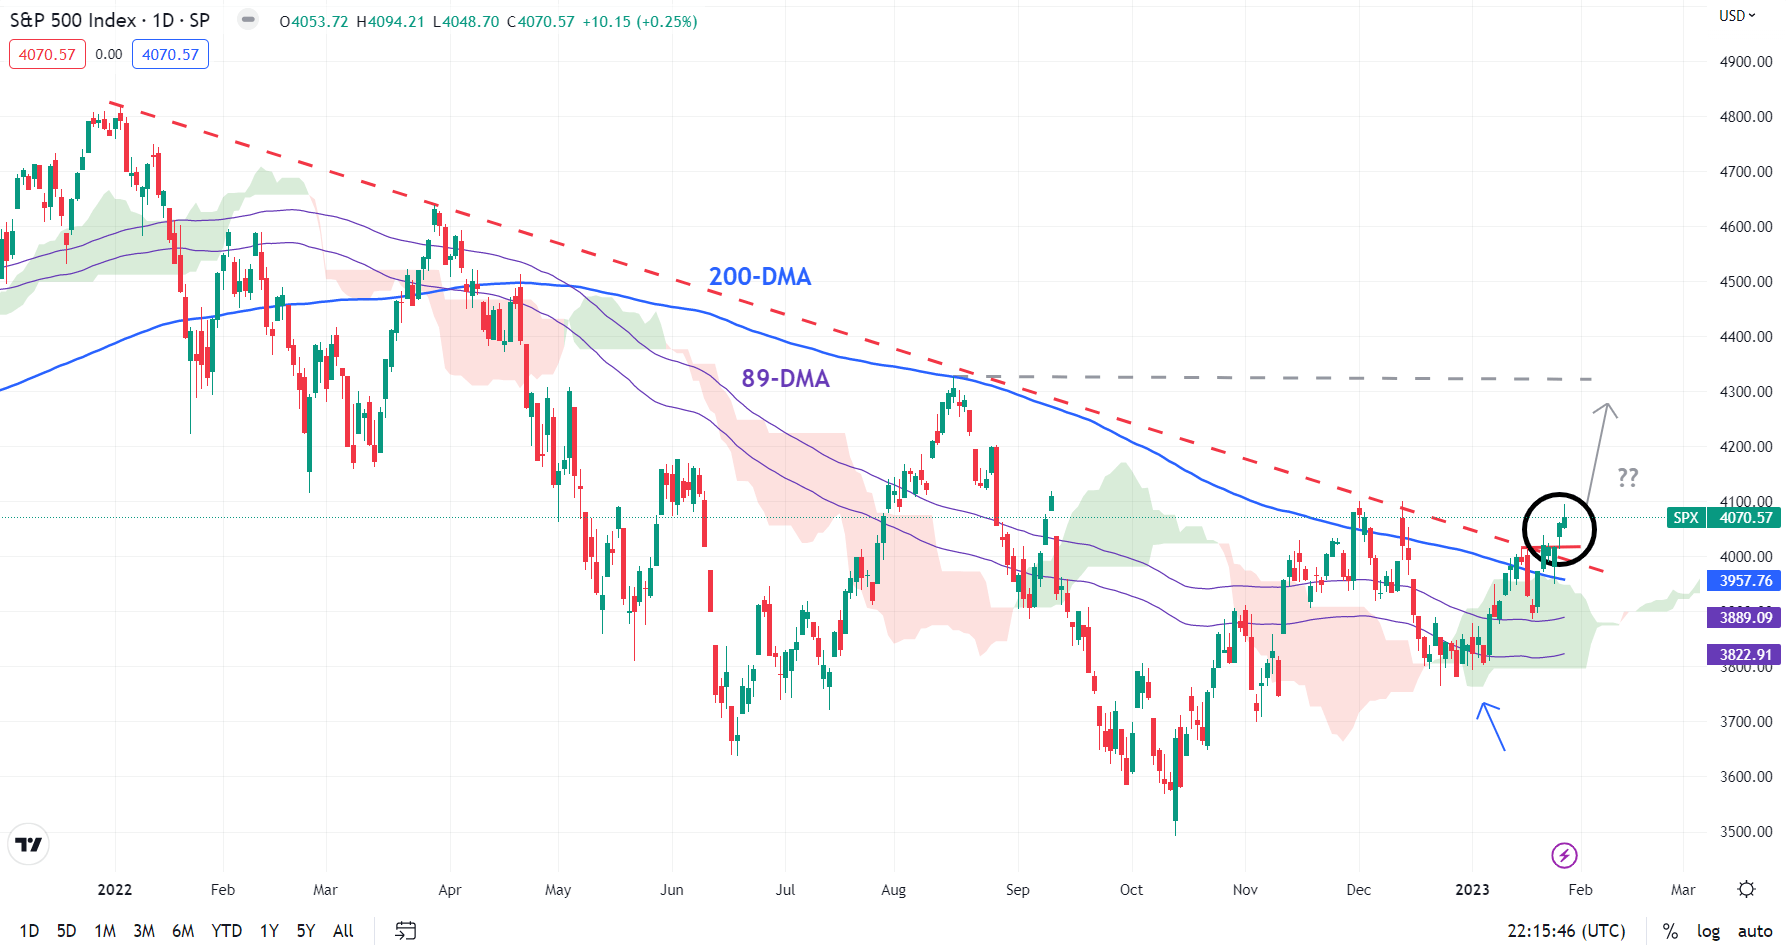
Chart Created Using TradingView
Improving momentum on lower timeframe charts and the rise above a key downtrend line from early 2022 suggest that the tide could be turning up for the index. This follows a hold last month above the key Ichimoku cloud support on the daily chart, creating a higher low in the process. If the index manages to break above 4100, it would be the first sequence of higher-highs-higher-lows on the weekly charts since the downtrend began a year ago. Importantly, such a break could open the door toward the August high of 4325.
NASDAQ 100 INDEX TECHNICAL OUTLOOK – BULLISH
Two important developments on technical charts in recent days indicate the Nasdaq 100 index could be getting ripe for an uptrend. The rise above the Ichimoku cloud and the 89-day moving average on higher momentum (the 14-day Relative Strength Index rise to 68 – a rise above 60-65 tends to imply that an uptrend is gaining steam).
NASDAQ 100 Daily Chart
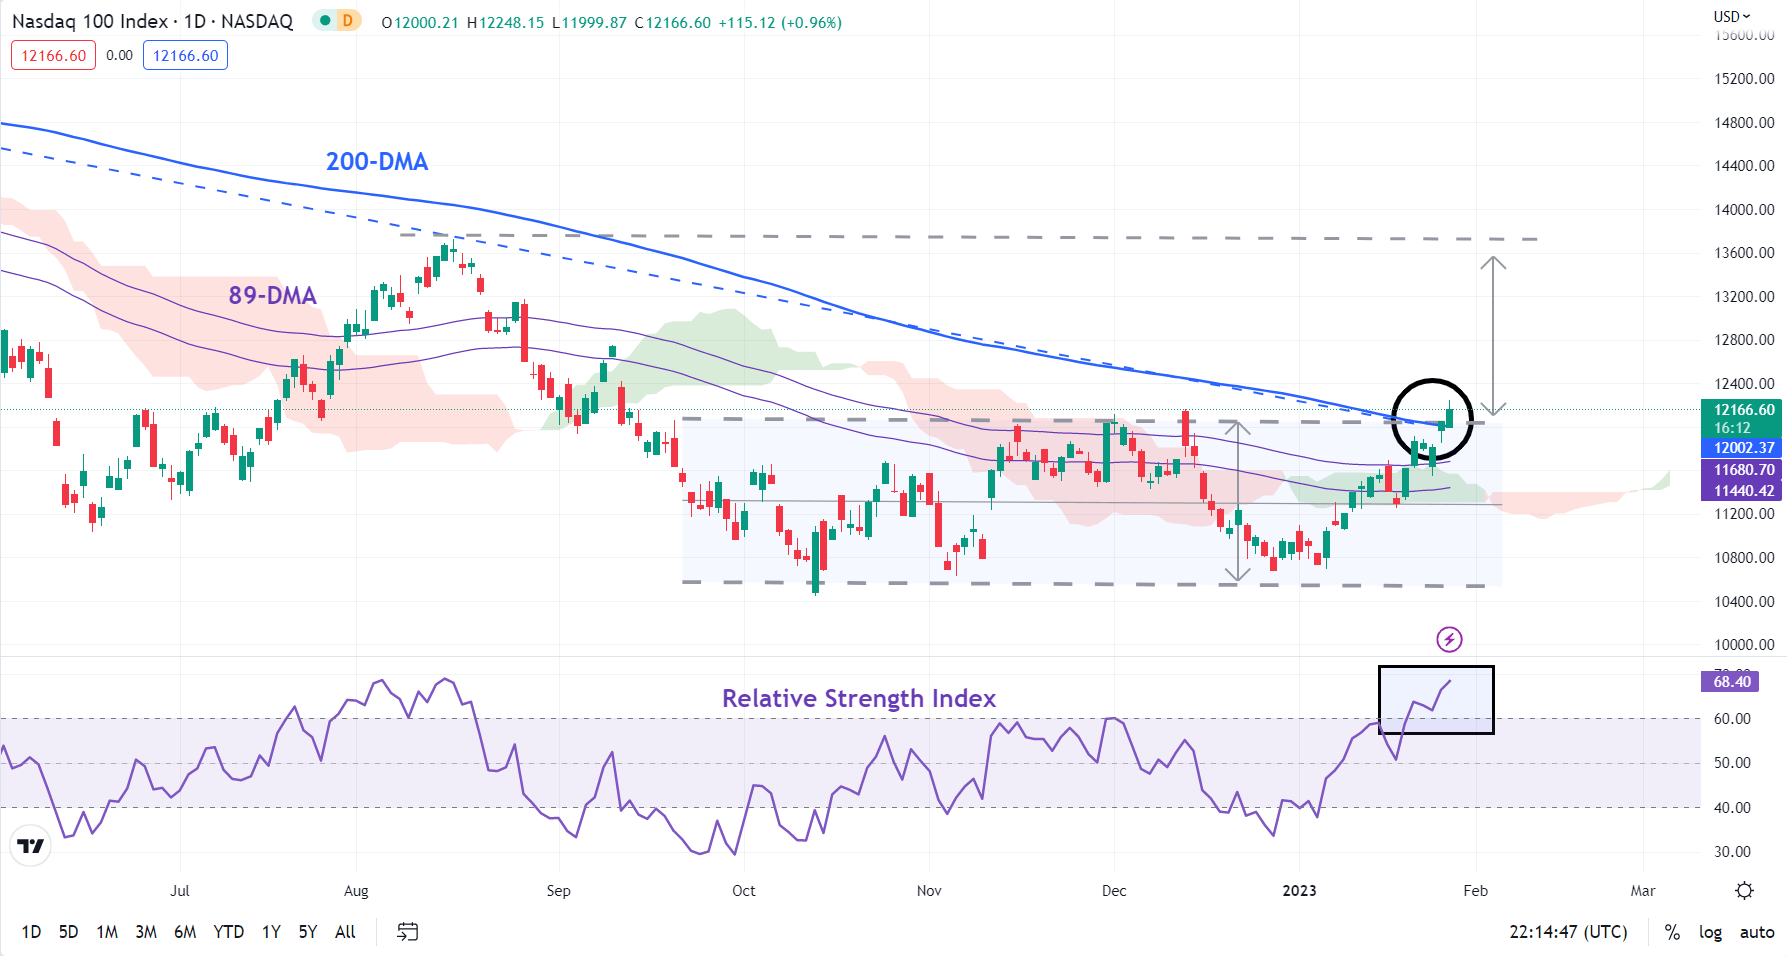
Chart Created Using TradingView
Moreover, the close on Friday above a stiff converged hurdle, including the December high of 12166 and the 200-day moving average, is a sign that the trend could be turning up. A decisive close (two daily closes) could pave the way toward the August high of 13720, roughly the price objective of the sideway channel since the end of last year (see the daily chart).
On the downside, immediate support is at the mid-January low of 11252. Stronger support is on a horizontal trendline from the end of 2022 (at about 10600).

--- Written by Manish Jaradi, Strategist for DailyFX.com


