


CRUDE OIL, WTI, NATURAL GAS, NG - Outlook:
- Crude oil’s break above key resistance points to further rise.
- Immediate downside risks in natural gas haven’t been eliminated.
- What is the outlook for crude oil and natural gas and what are the key levels to watch?

Crude Oil: A reversal of the downtrend?
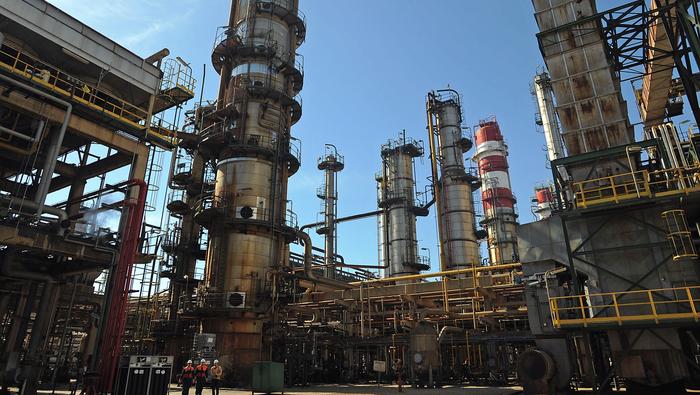
Crude oil’s ascent appears to be getting stronger, as reflected in the steepening angle of the uptrend since June. This follows a break above quite a few times tested resistance on a horizontal trendline since the end of 2022. has triggered a breakout from a multi-month sideway zone. The break has opened the way toward the October high of 93.00.
Crude Oil Weekly Chart
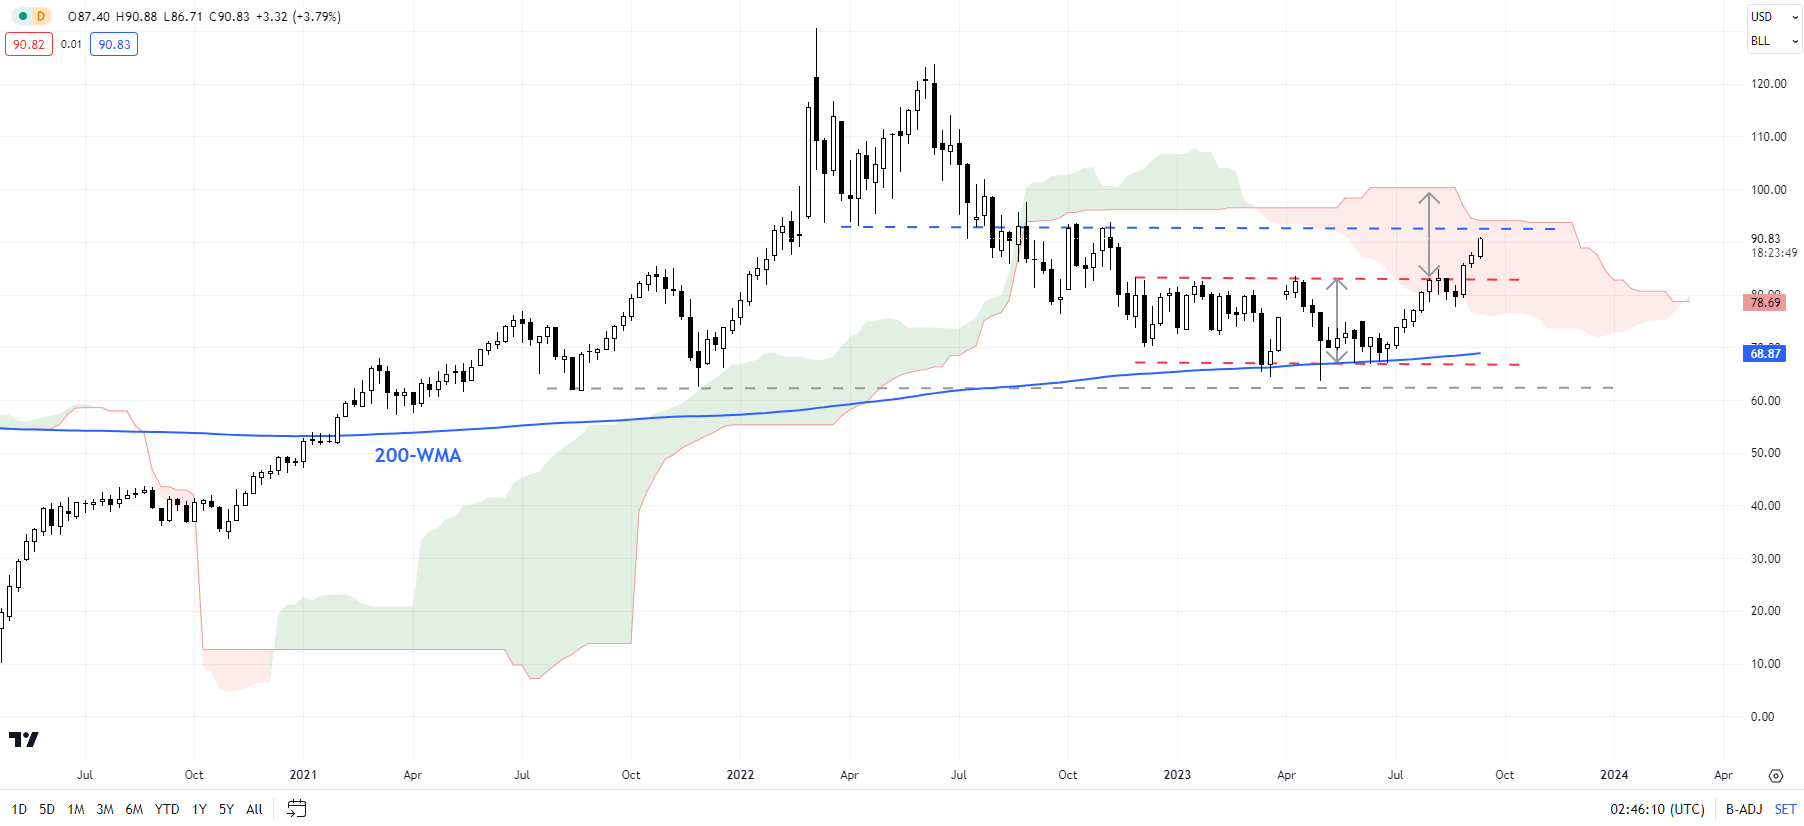
Chart Created by Manish Jaradi Using TradingView
The bullish break has triggered a double bottom (the March and May lows), pointing to a potential rise toward 103. The potential for a significant low / capitulation was first pointed out in May. See “Crude Oil Extends Slide in Asia: Is This Capitulation?”, published May 4. Crude oil’s subsequent break above-converged support on the 89-day moving average and the 200-day moving average.
Crude Oil 240-Minute Chart
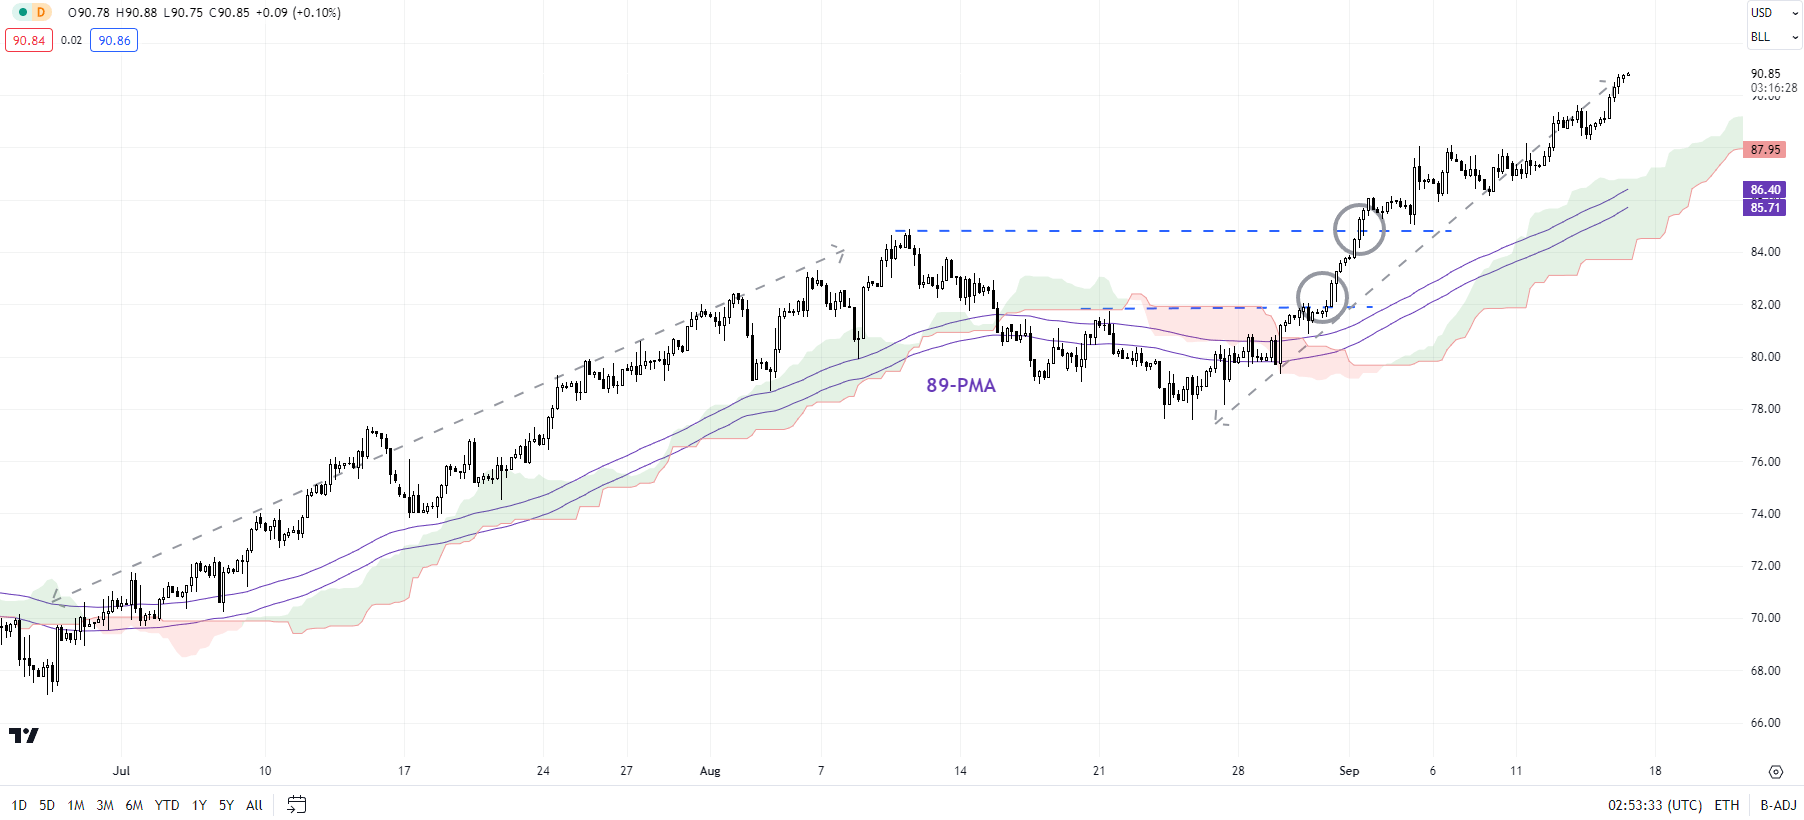
Chart Created by Manish Jaradi Using TradingView
Last month’s crack above a horizontal trendline from January (that came at about 83.00) sealed the breakout from a multi-week range. Oil looks set to test another horizontal trendline from 2022 (at about 93.00), which would be a key confirmation of the resumption of the broader uptrend. Such a break would also coincide with the upper edge of the Ichimoku cloud on the weekly charts.
Crude Oil Daily Chart
Chart Created by Manish Jaradi Using TradingView
Natural gas: Holding above support
The intraday trading ranges in natural gas have narrowed further in recent weeks. Despite the narrowing volatility, natural gas has held above the crucial horizontal trendline since July (at about 2.40-2.50). At the same time, natural gas hasn’t been able to build any meaningful upward momentum since after staging a lower top at the end of August. For more discussion, see “Crude Oil Attempts to Clear a Tough Barrier; Natural Gas Risks Further Losses,” published September 6.
Natural Gas Daily Chart
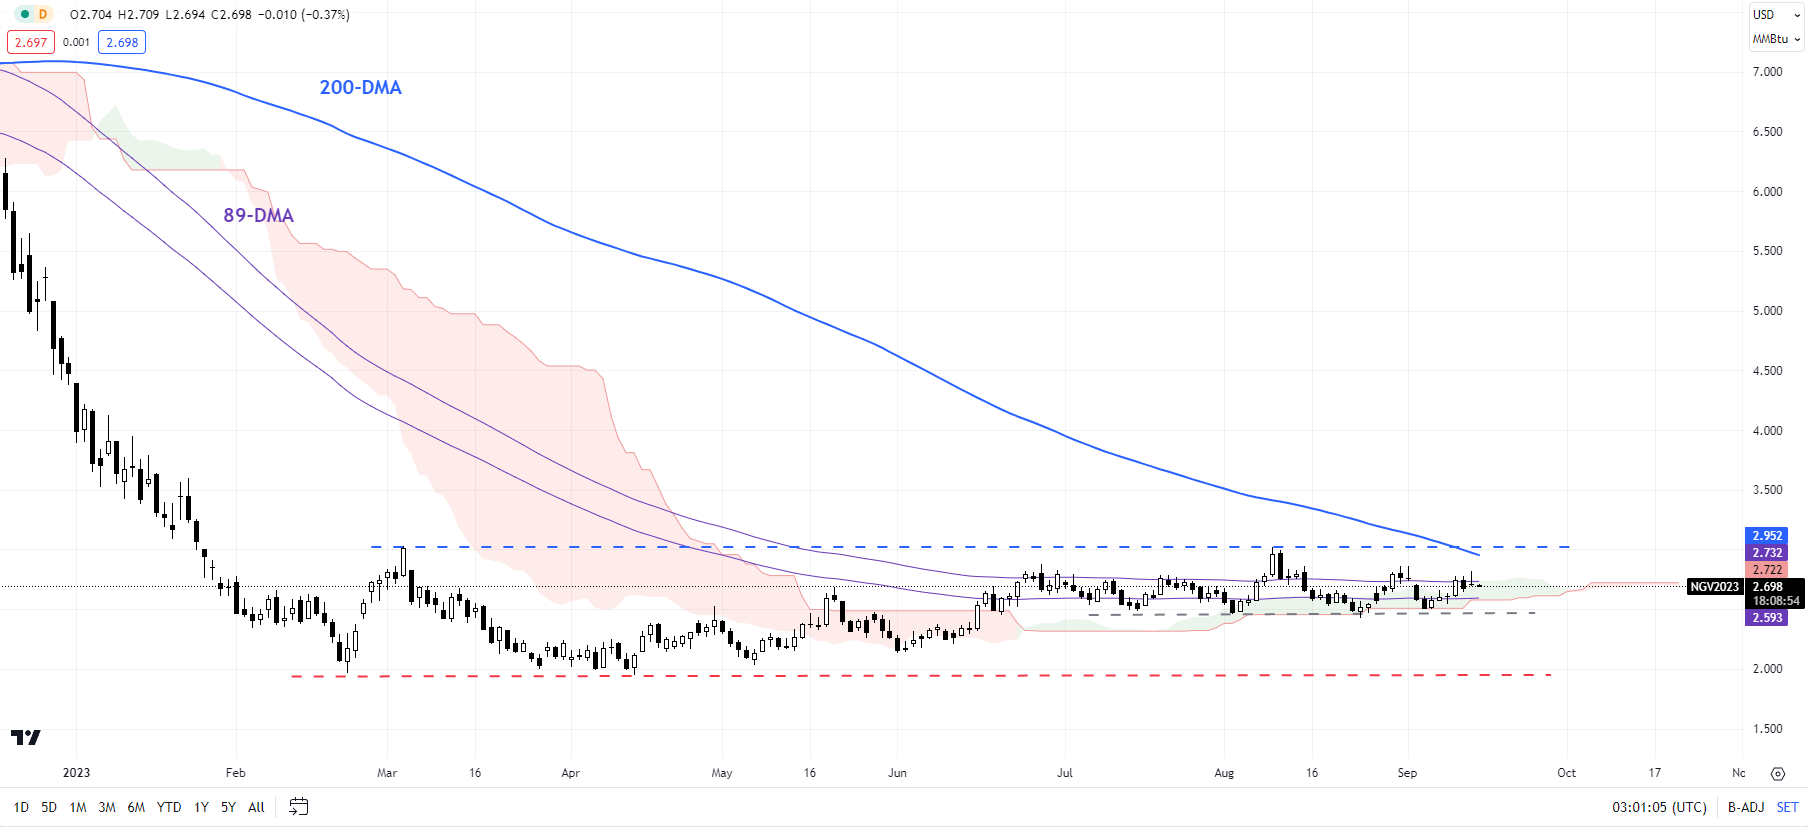
Chart Created by Manish Jaradi Using TradingView
The failure to reach the early-August high raises the risk that the five-month-long rebound is over, provided the 2.40-2.50 support gives way. The risk of a retreat in natural gas was first pointed out in “How Much More to Go in Crude Oil? Is There More Upside in Natural Gas?”, published on August 11. Any break below 2.40-2.50 could pave the way toward the Q1-2023 lows of around 1.95-2.00.
Natural Gas Weekly Chart
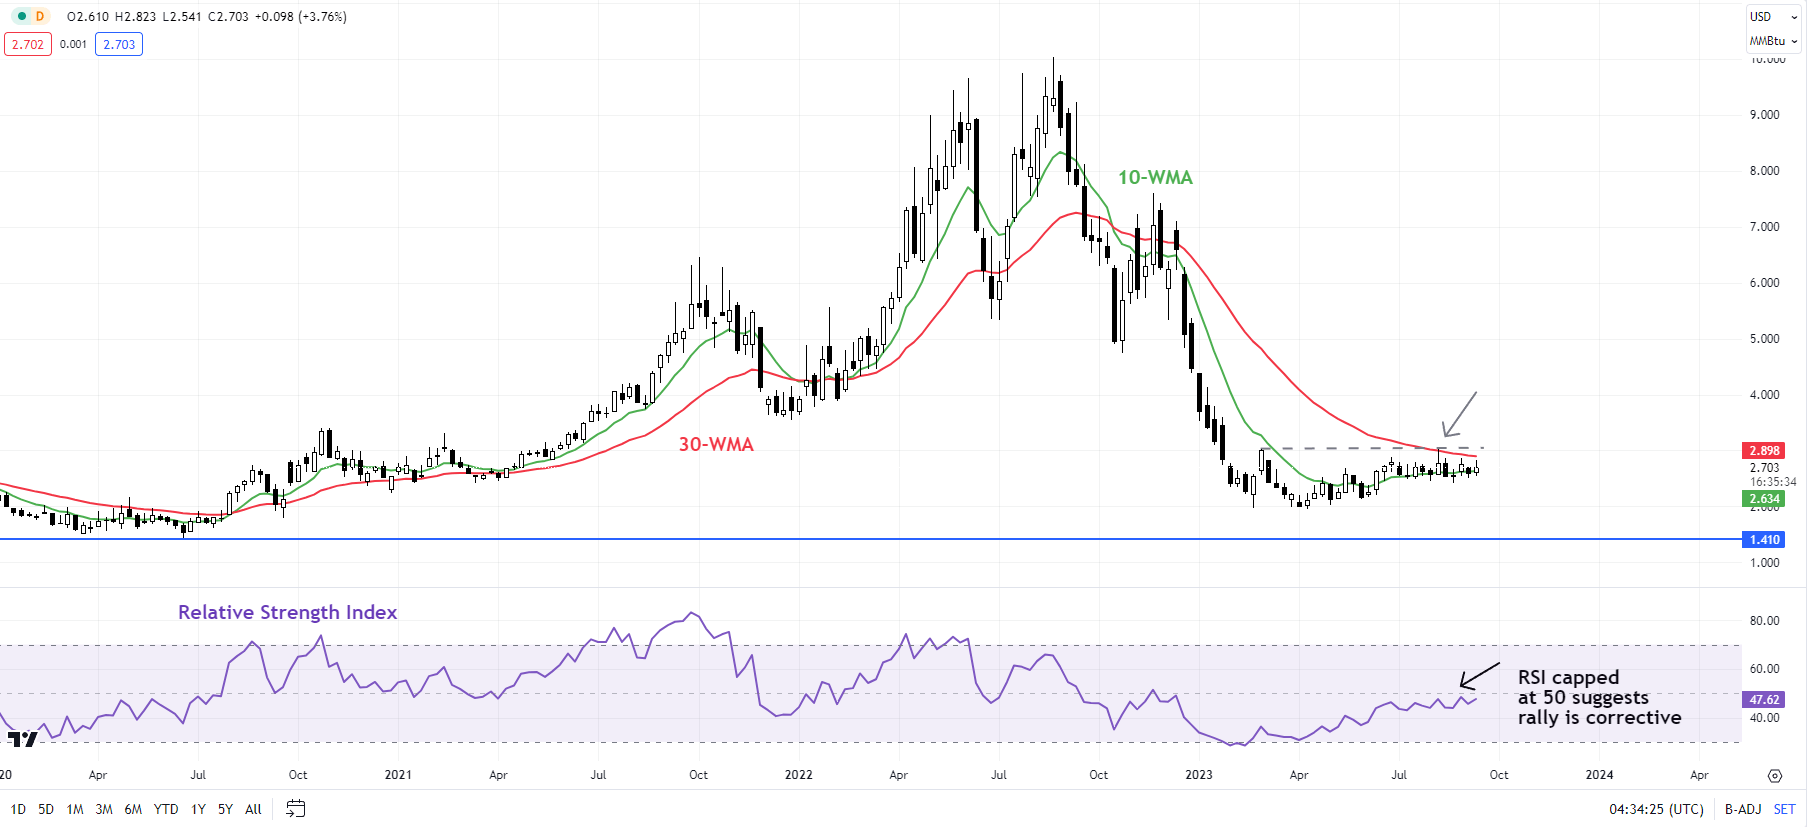
Chart Created by Manish Jaradi Using TradingView
While it holds above 1.95-2.00, a base-building process could be underway following the sharp decline last year. The possibility of natural gas bottoming was first highlighted in early 2023 - see “Natural Gas Price Action Setup: Is the Slide Overdone?”, published February 21, and subsequently “Natural Gas Week Ahead: Base Building May Have Started”, published May 22, and “Natural Gas Price Rebound Could Extend; What’s Next For Crude Oil?”, published May 18.

--- Written by Manish Jaradi, Strategist for DailyFX.com
--- Contact and follow Jaradi on Twitter: @JaradiManish


