


CRUDE OIL, WTI, NATURAL GAS, NG - Outlook:
- Crude oil looks overbought as it tests vital resistance.
- Natural gas remains in a slow and hesitant uptrend.
- What is the outlook for crude oil and natural gas and what are the key levels to watch?

Natural gas: A hesitant rally
The sharp fall on Thursday isn’t new to natural gas’ recovery script – two steps forward one step back has been a feature of the hesitant uptrend from early 2023. After weeks of sideways movement, natural gas attempted to break past the upper edge of the range at about 2.70 only to surrender all the gains in a day.
That’s because the downtrend since late 2022 has been established, with several pivot points created along the way. For a pronounced uptrend to take place, natural gas would need to clear all the hurdles. One such barrier is the March high of 3.00-3.05 (including the March high and the 30-week moving average). With momentum beginning to falter, it could be tough to clear the resistance area, at least on the first attempt.
Natural Gas Daily Chart
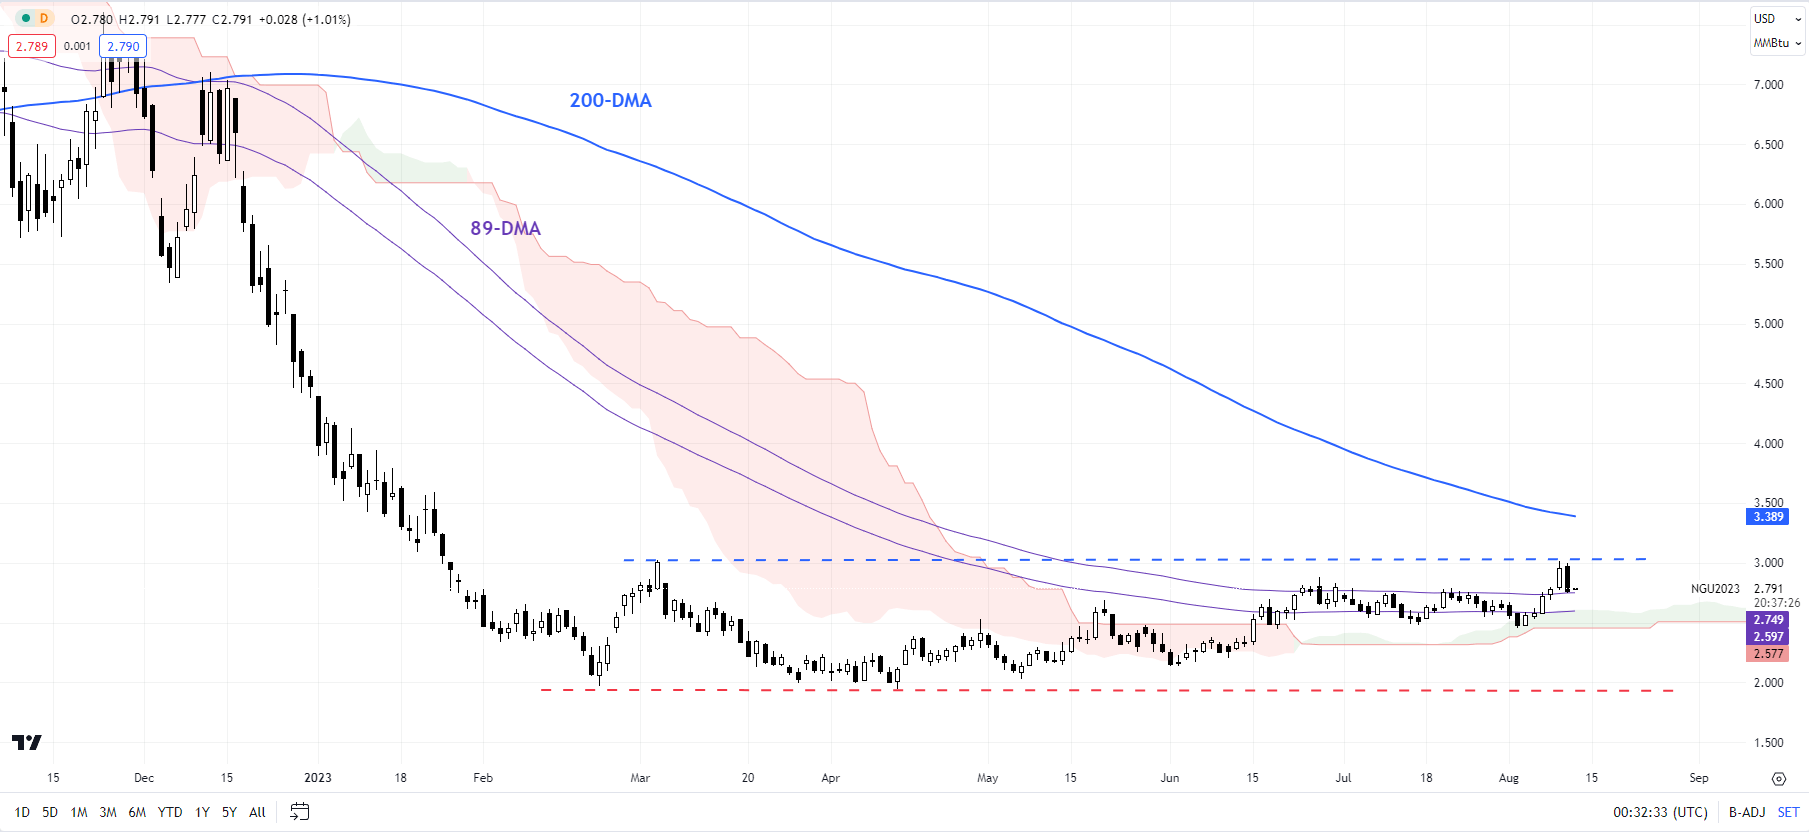
Chart Created by Manish Jaradi Using TradingView
Any break below the resistance-turned-support at 2.70 could open the way toward strong support at 2.40-2.50, including the lower edge of the Ichimoku cloud on the daily charts. While 2.40-2.50 remains intact, natural gas could re-attempt to decisively clear 2.70. Any break above 2.70 could open the door toward the 200-day moving average (now at about 3.40).
Natural Gas Weekly Chart
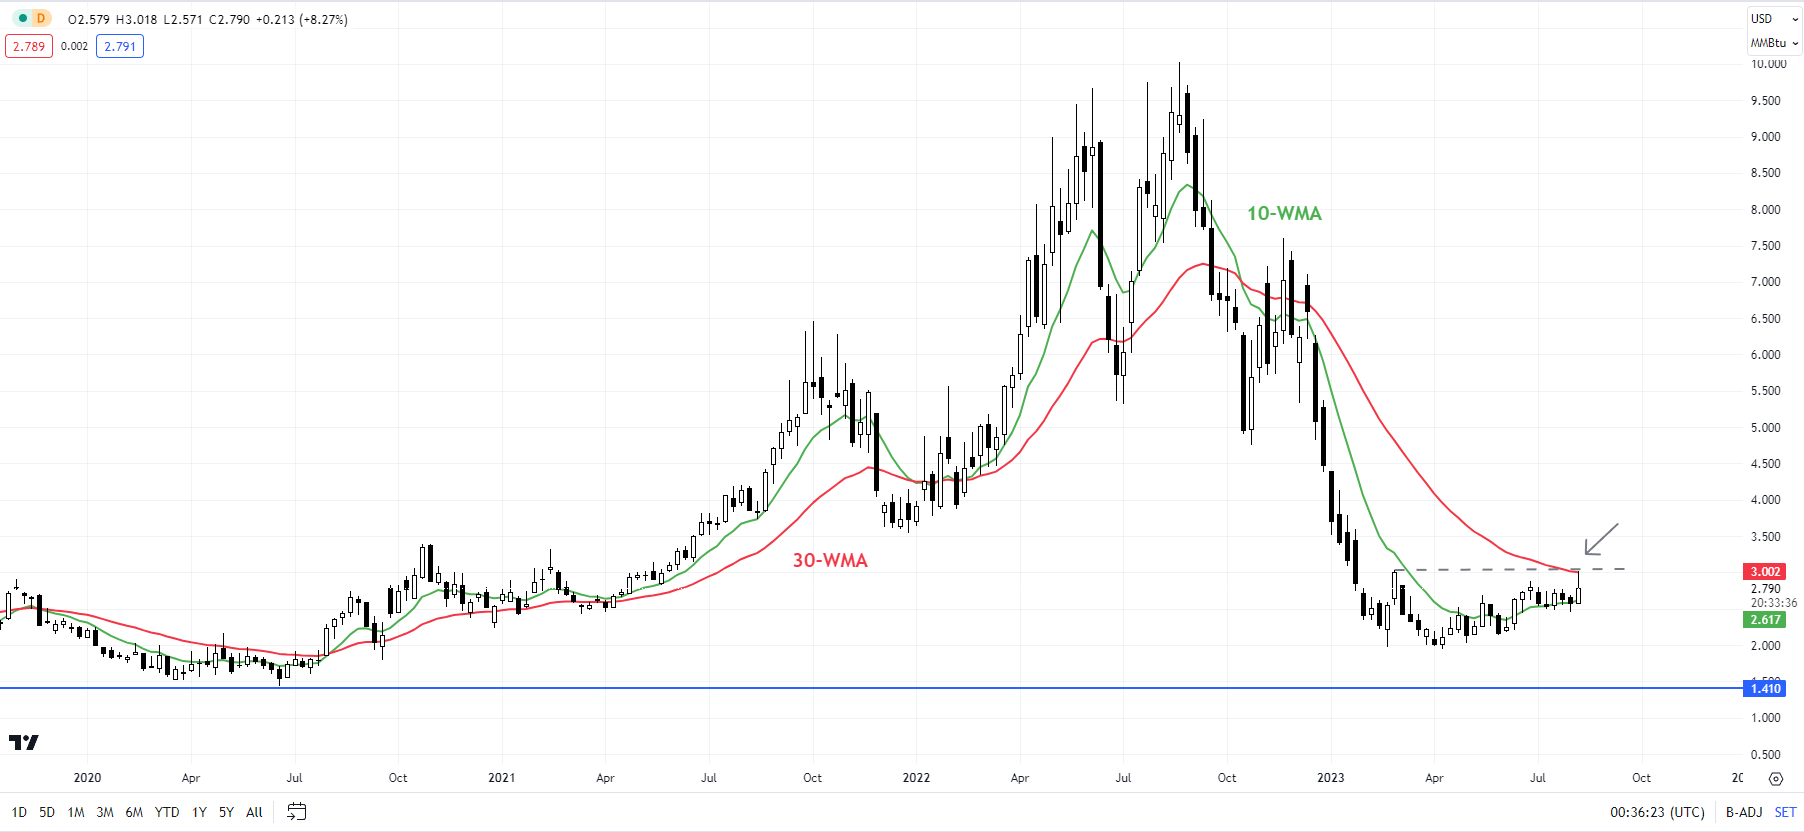
Chart Created by Manish Jaradi Using TradingView
From a medium-term perspective, as highlighted in recent updates, the downward pressure has abated as natural gas found support around the psychological 2.00 mark. Natural gas would need to clear the 200-day moving average for the rally from March to be more than just corrective. See “Natural Gas Week Ahead: Base Building May Have Started”, published May 22, and “Natural Gas Price Rebound Could Extend; What’s Next For Crude Oil?”, published May 18. The possibility of natural gas bottoming was first highlighted in early 2023 - see “Natural Gas Price Action Setup: Is the Slide Overdone?”, published February 21.
Crude Oil 240-Minutes Chart

Chart Created by Manish Jaradi Using TradingView
Crude Oil: Runs into a crucial hurdle
On technical charts, crude oil has been flirting with the upper edge of a rising pitchfork channel since mid-June, coinciding with other hurdles at the April high of 83.50 and the 89-week moving average. Overbought conditions coupled with negative divergence on lower timeframe charts (rising price associated with a stalling in momentum) suggest crude oil could find it tough to clear the resistance, at least in the first attempt.
Crude Oil Weekly Chart
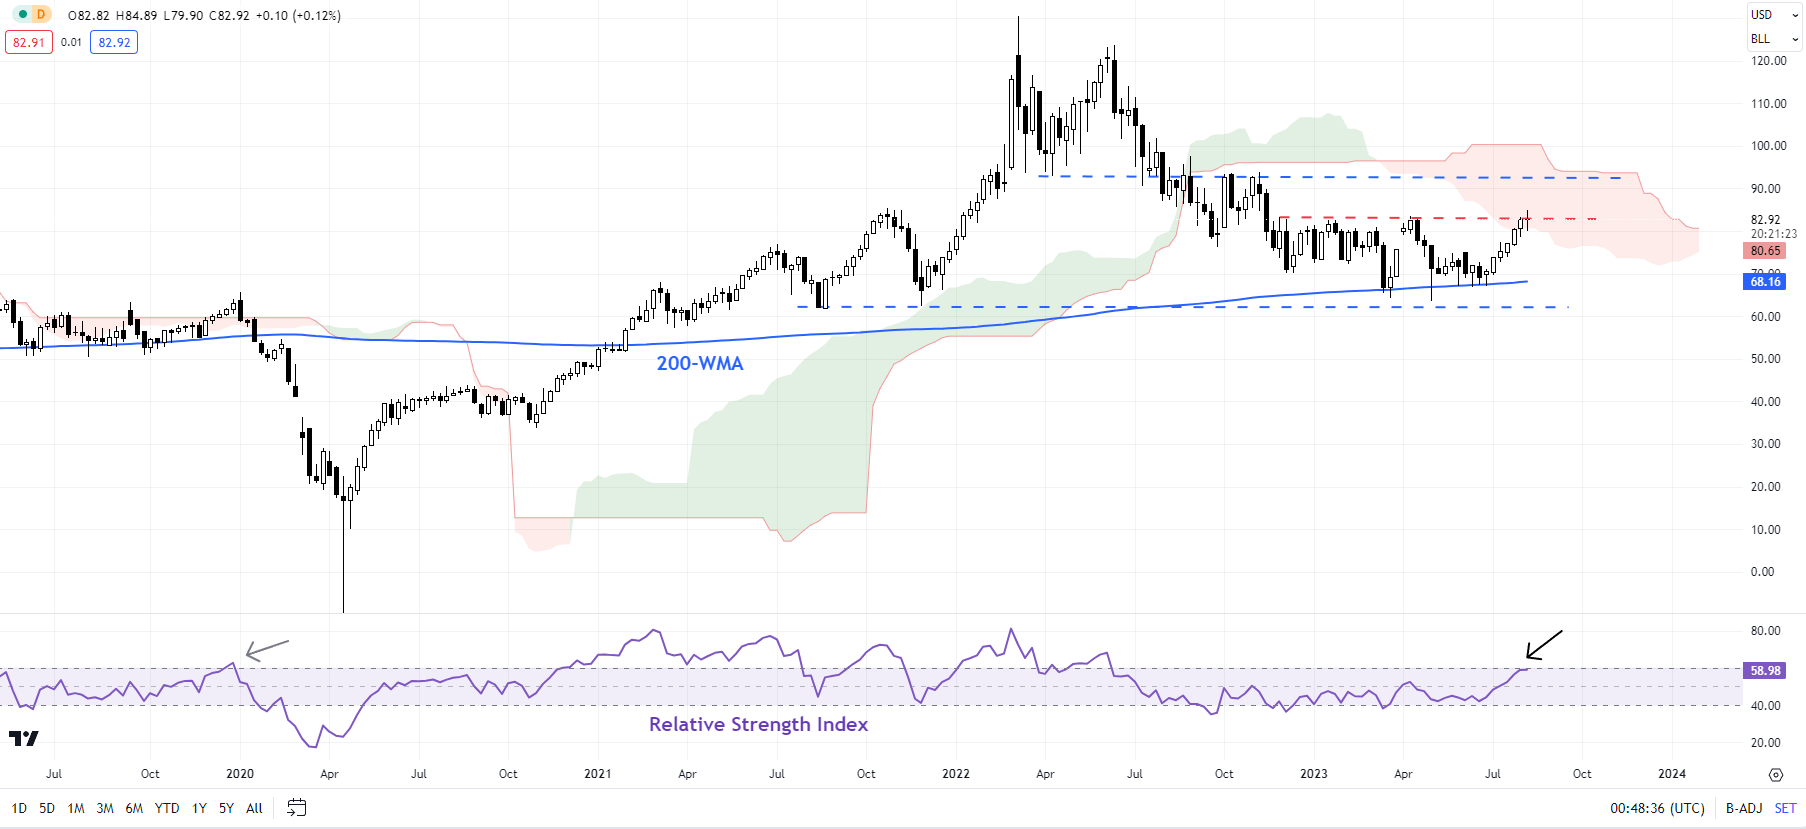
Chart Created by Manish Jaradi Using TradingView
To be fair, there is no sign of reversal of the uptrend yet – the higher-highs-higher-lows pattern is intact. A break below the immediate cushion area around 80.00-81.00 would be needed for the short-term upward pressure to fade. Until then, the path of least resistance remains sideways to up.A decisive break above 83.50 could initially open the way toward the November high of 93.75.
Crude Oil Daily Chart
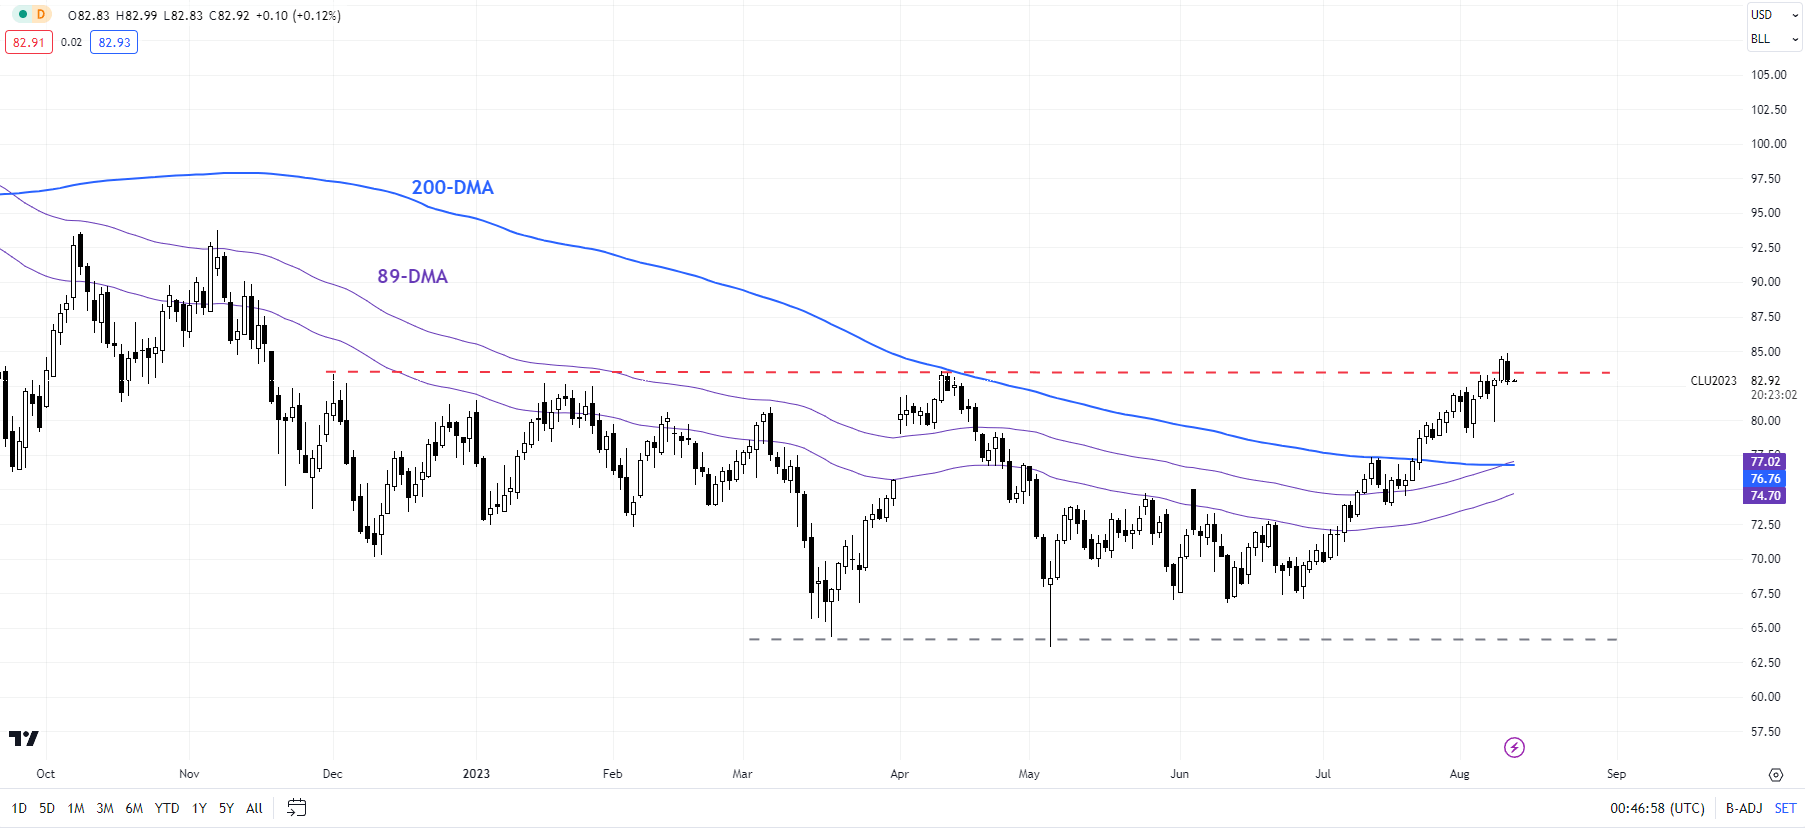
Chart Created by Manish Jaradi Using TradingView
Still, as discussed in a previous update, 83.50 is a crucial level. Unless crude oil breaks above the April high of 83.50, the path of least resistance is sideways to down. See “Crude Oil Extends Slide in Asia: Is This Capitulation?”, published May 4.

--- Written by Manish Jaradi, Strategist for DailyFX.com
--- Contact and follow Jaradi on Twitter: @JaradiManish


