


CRUDE OIL, WTI - Outlook:
- Crude oil extended its slide in Asia morning.
- Demand worries, high interest rates and banking-sector concerns weigh on oil prices.
- What is the outlook and what are the key levels to watch?

Crude oil extended its slide in Asia morning on continued worries regarding the demand for oil, rising real interest rates, and lingering banking sector concerns. However, on technical charts oil is testing vital support, raising the prospect of a pause in the slide or even a minor rebound.
Crude oil fell around 7% early Asia morning before stabilizing slightly, after the US Federal Reserve hiked interest rates by 25 basis points. Tightening monetary policy has pushed US real rates to multi-year highs – US 10-year real rate hit a 15-year high recently before pulling back slightly, according to data from the Federal Reserve Bank of Cleveland. Academic research has shown real interest rates are inversely correlated with oil prices.
Worries regarding the demand for oil amid a slowing global economy have overshadowed the surprise announcement of the output cut by OPEC+ producers in April. Global growth outlook has deteriorated over the past year, notwithstanding the modest upgrade recently, with Bloomberg median consensus for world GDP for 2023 at 2.5% on-year from 3.6% in early 2022. The International Energy Agency estimates China’s demand for oil would account for around 90% of the demand growth. However, the unexpected contraction in China’s manufacturing activity in April suggests that post-Covid recovery remains uneven.
Crude Oil Daily Chart
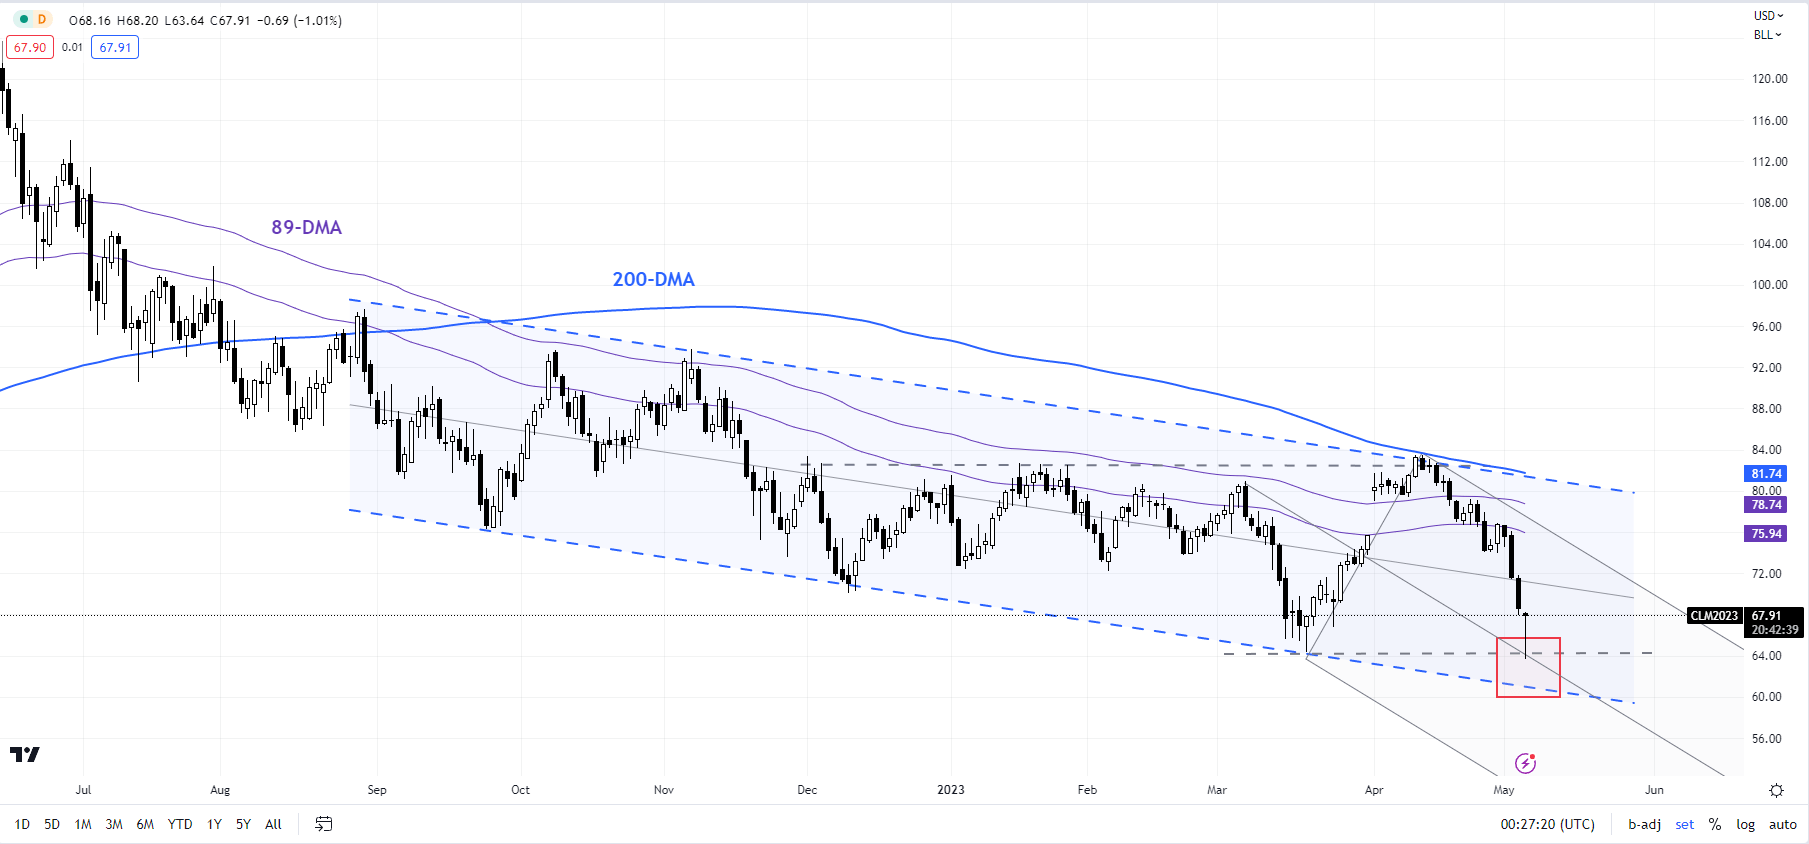
Chart Created by Manish Jaradi Using TradingView
Concerns about the US banking sector resurfaced last week after First Republic’s shares plunged on the larger-than-expected drop in deposits, prompting US regulators to seize the institution on Monday, the third major US institution to fail in two months. Furthermore, news that PacWest Bancorp is exploring strategic options, including a sale, pushed US regional lenders lower in after-market trading.
Crude Oil Daily Chart
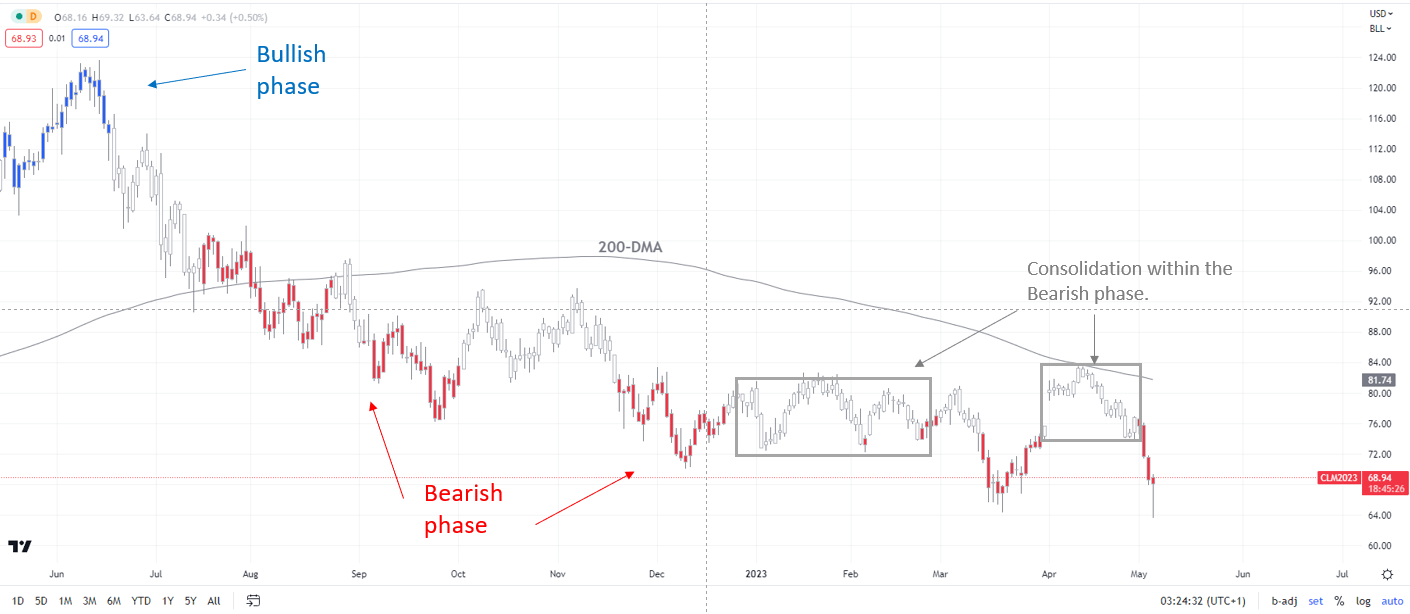
Chart Created by Manish Jaradi Using TradingView
Note: In the above colour-coded chart, Blue candles represent a Bullish phase. Red candles represent a Bearish phase. Grey candles serve as Consolidation phases (within a Bullish or a Bearish phase), but sometimes they tend to form at the end of a trend. Note: Candle colors are not predictive – they merely state what the current trend is. Indeed, the candle color can change in the next bar. False patterns can occur around the 200-period moving average, or around a support/resistance and/or in sideways/choppy market. The author does not guarantee the accuracy of the information. Past performance is not indicative of future performance. Users of the information do so at their own risk.
On technical charts, after a brief consolidation, crude oil is back in a bearish phase since mid-2022, as the colour-coded candlestick charts based on trending/momentum indicators show. See recent updates (April 10,April 13, andApril 26) highlighting the consolidation phase despite the output cut by OPEC and its allies in April.
Crude Oil Weekly Chart
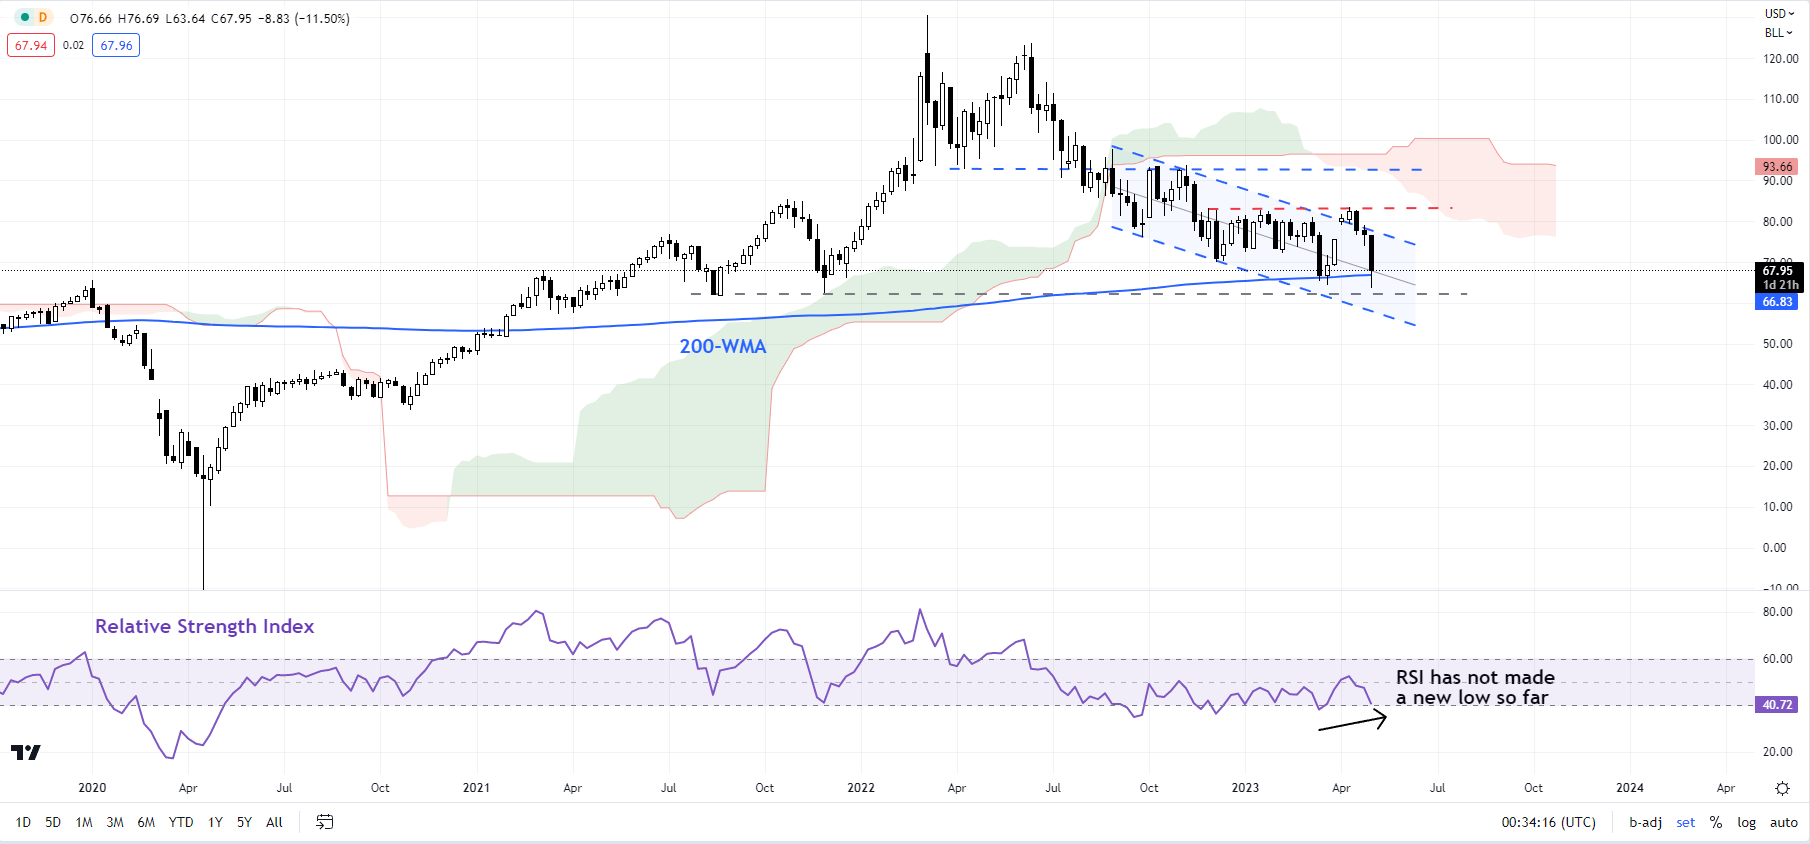
Chart Created by Manish Jaradi Using TradingView
Oil is now testing major converged support: the 200-week moving average, the March low, coinciding with the median line of a declining pitchfork channel from early March. While the price action is still unfolding, 14-week Relative Strength Index hasn’t made a new low despite oil prices around the March low. Failure of momentum to make a new low as the price makes a new low is a sign that the slide could be losing steam.
Crude Oil 240-minute Chart
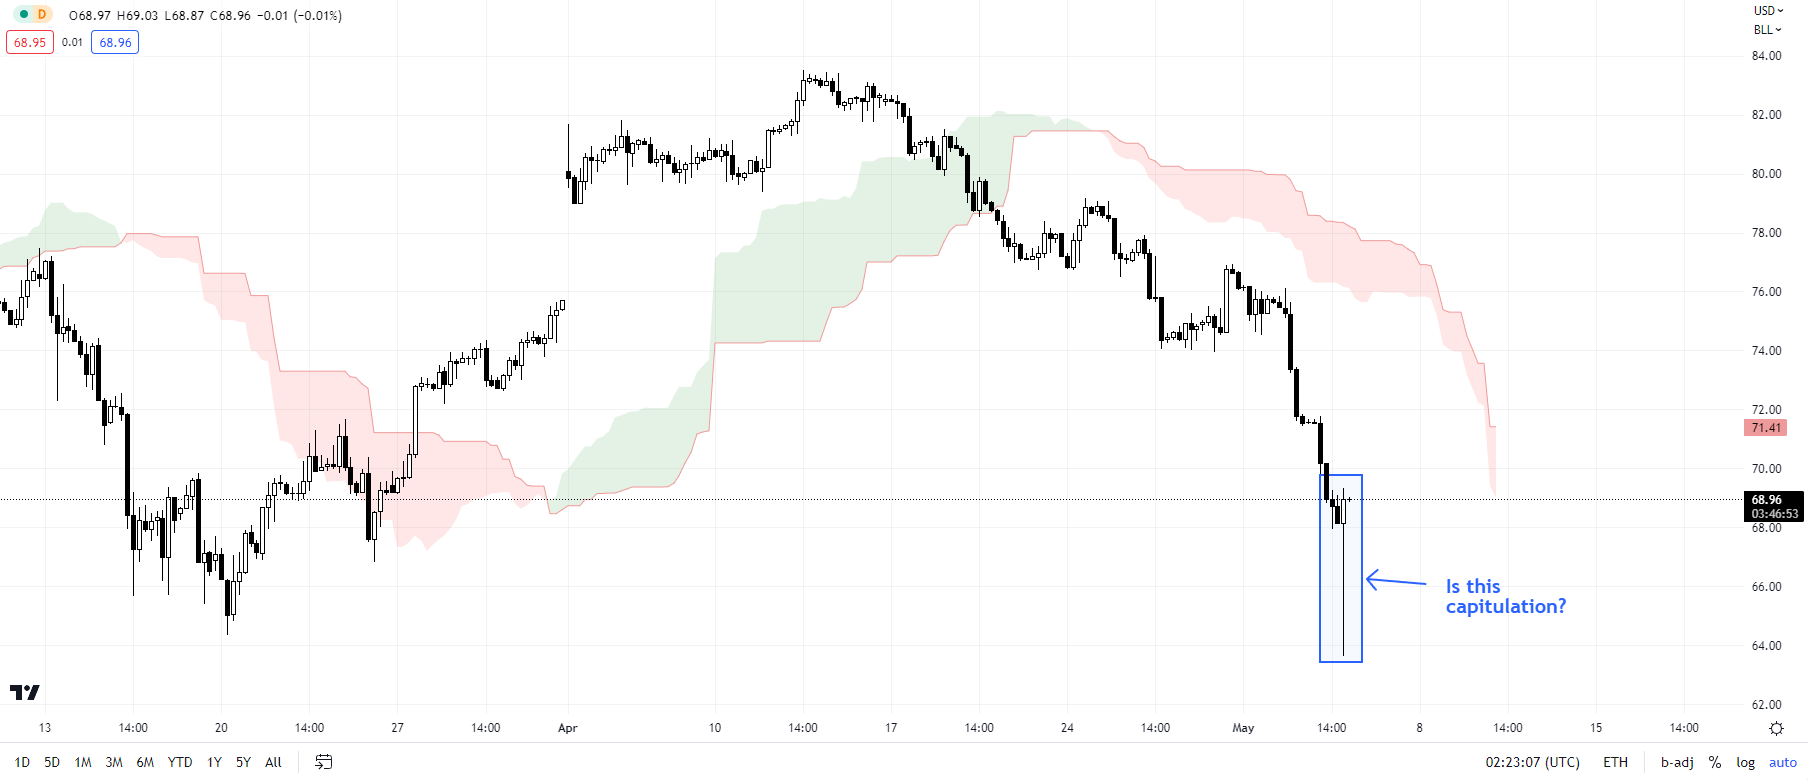
Indeed, a bullish hammer pattern on the hourly charts Thursday in Asia early morning could be an early sign that oil prices may have capitulated. Much depends on how it closes on the remaining two days of the week. If a similar pattern forms at the end of the day on Thursday followed by a higher close on Friday, it could provide some confidence to bulls. However, unless the 82.00-84.00 resistance is broken, the path of least resistance for oil is sideways to down.Below the March low of 64.10, there is another cushion at the August 2021 low of 61.75 followed by the March 2021 low of 57.25.
Trade Smarter - Sign up for the DailyFX Newsletter
Receive timely and compelling market commentary from the DailyFX team
--- Written by Manish Jaradi, Strategist for DailyFX.com
--- Contact and follow Jaradi on Twitter: @JaradiManish


