


US Dollar, DXY Index, 2002 Highs, Rare Trend – Weekly Technical Outlook
- The odds of US Dollar’s 1.5% rise last Friday was about 0.1%
- DXY shot past key levels of resistance, eyeing new highs since 2002
- What are key technical levels to watch to the upside/downside?
Trade Smarter - Sign up for the DailyFX Newsletter
Receive timely and compelling market commentary from the DailyFX team
US Dollar Technical Forecast – Bullish
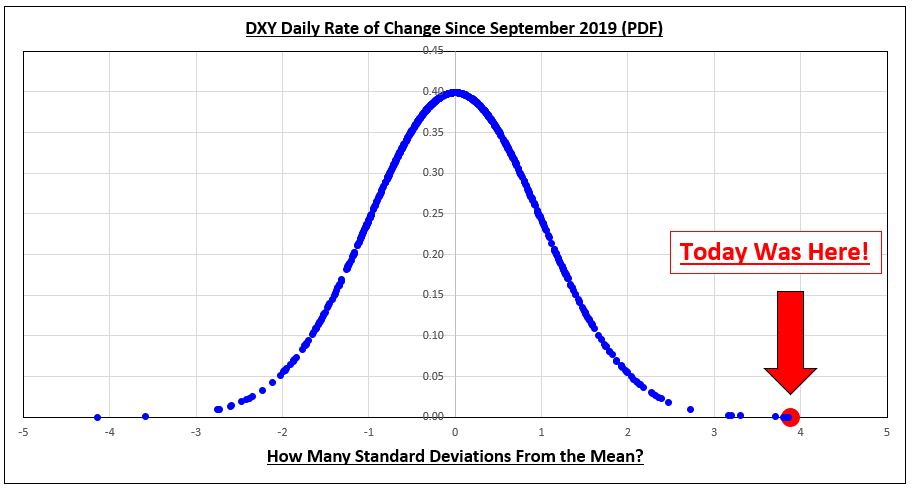
Last week was a particularly rare week for the US Dollar. On Friday, the DXY index gained about 1.5 percent in the best 24 hours since March 2020. To give you some context of how rare that was, we can analyze the daily rate of change data over the past three years. On the chart below is this information plotted using a probability density function (PDF).
All the PDF does is measure how many standard deviations a given day was away from the average. On Friday, it was almost 3.9 standard deviations away from the mean. Putting it another way, the probability of such an event occurring was 0.1 percent! The US Dollar has clearly been on an impressive winning streak as of late, is there more growth to be had?
Being Lucky
Data Source: Bloomberg
Chart Prepared by Daniel Dubrovsky
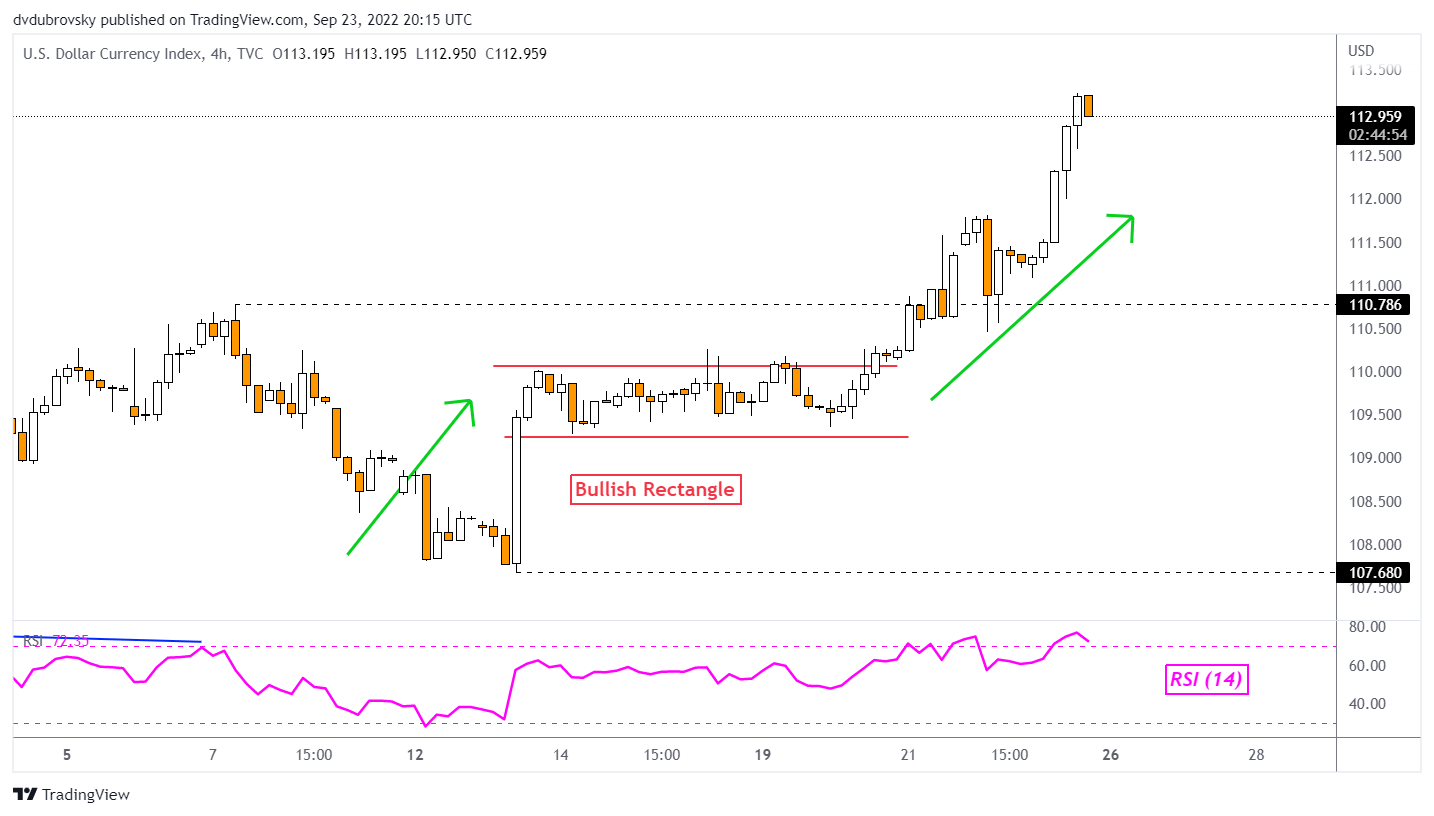
DXY 4-Hour Chart
Last week I also wrote the US Dollar technical forecast. On the 4-hour chart, we were looking at a Bullish Rectangle that was brewing. As expected, the chart formation pulled through. After confirming a breakout above the pattern, the US Dollar extended upward and broke above the early September swing high at 110.786 – see chart below. A lack of RSI divergence on this timeframe going forward seems to show that momentum is strong. What about the daily chart?
| Change in | Longs | Shorts | OI |
| Daily | -1% | -4% | -3% |
| Weekly | 4% | -10% | -5% |
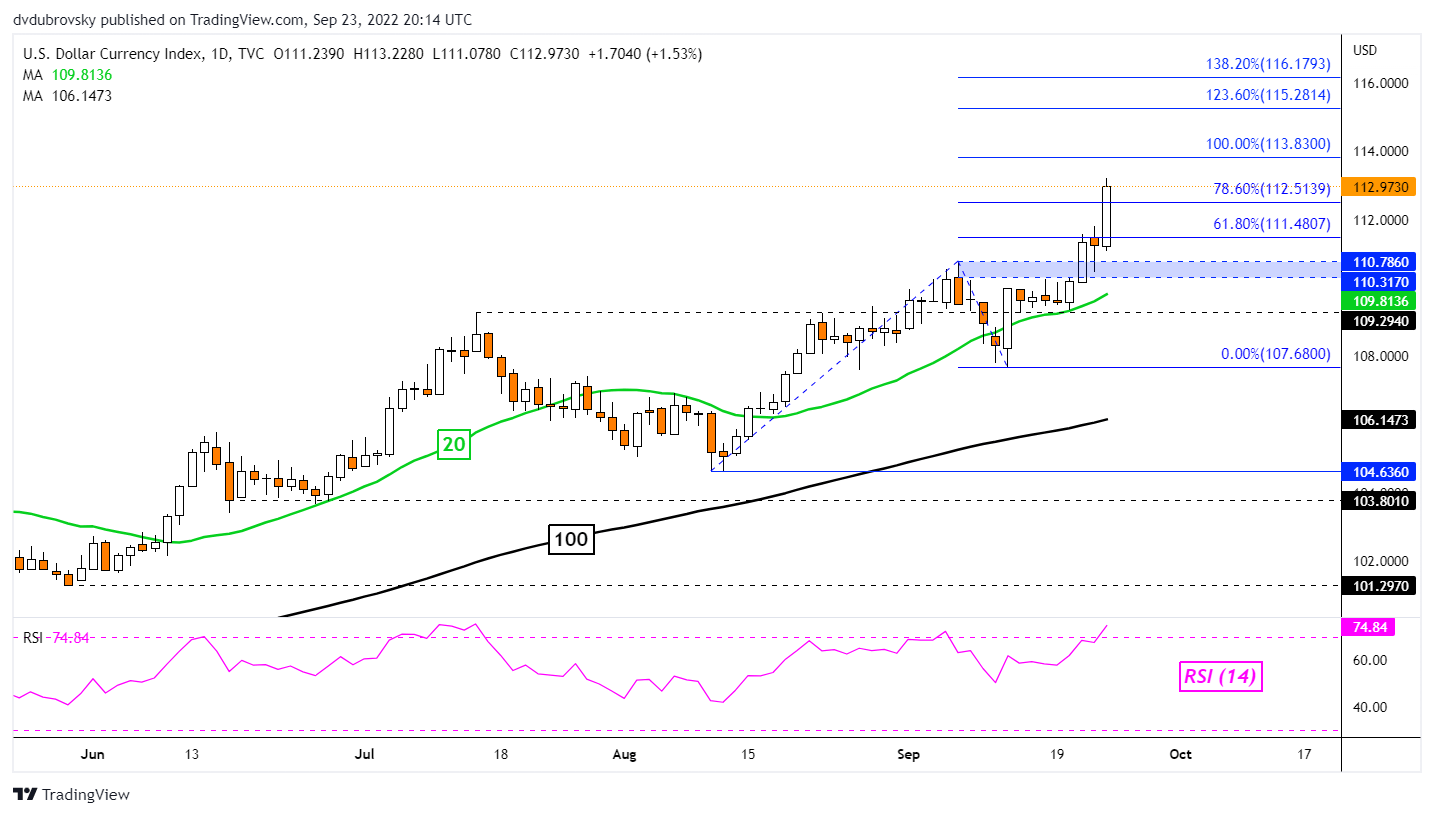
DXY Daily Chart
The US Dollar confirmed a breakout above the critical 110.786 – 110.317 resistance zone, opening the door to extending the broader uptrend that has been taking prices to their highest since 2002. Prices cleared the 61.8% and 78.6% Fibonacci extensions at 111.48 and 112.51, respectively. Now, immediate resistance seems to be at the 100% level at 113.83 followed by 123.6% at 115.28. In the event of a turn lower, keep a close eye on the 20-day Simple Moving Average (SMA). This could kick in as support, maintaining the broader upside focus.
--- Written by Daniel Dubrovsky, Strategist for DailyFX.com
To contact Daniel, use the comments section below or@ddubrovskyFXon Twitter


