


US Dollar, DXY Index, Bullish Rectangle, RSI – Weekly Technical Outlook
- US Dollar gained this past week, but uptrend did not continue
- Still, the weekly and daily settings hint at an upward outlook
- Will a Bullish Rectangle formation unfold on the 4-hour chart?

US Dollar Technical Forecast – Slightly Bullish
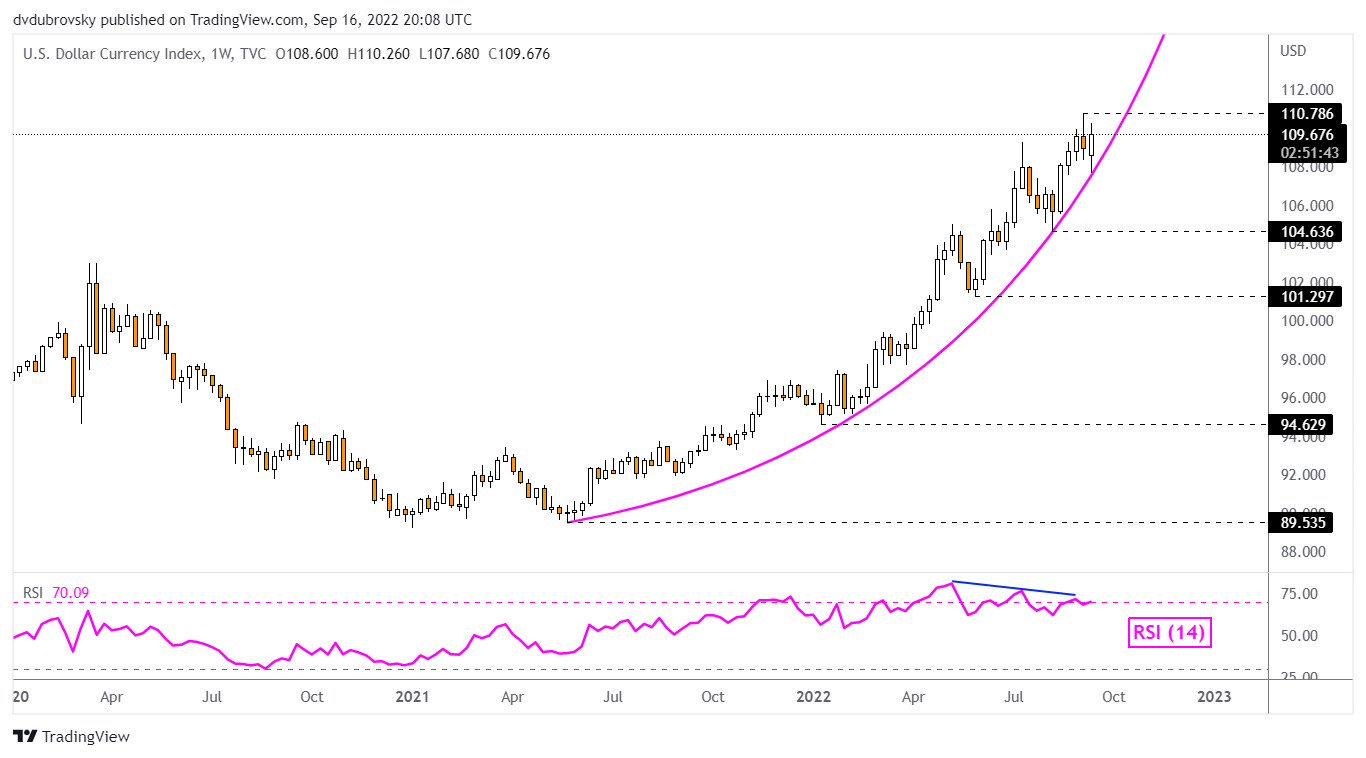
The US Dollar aimed higher this past week, but prices were unable to extend the dominant uptrend. This can be seen by looking at the DXY Dollar Index weekly chart below. Prices have been rallying since the middle of 2021 exponentially. In early September, the US Dollar left behind resistance at 110.786. Even though prices rallied over the past 5 trading sessions, they were unable to reach the former. Still, the broader upside focus remains intact. Negative RSI divergence is persisting, however, showing that upside momentum is fading.
DXY Dollar Index Weekly Chart
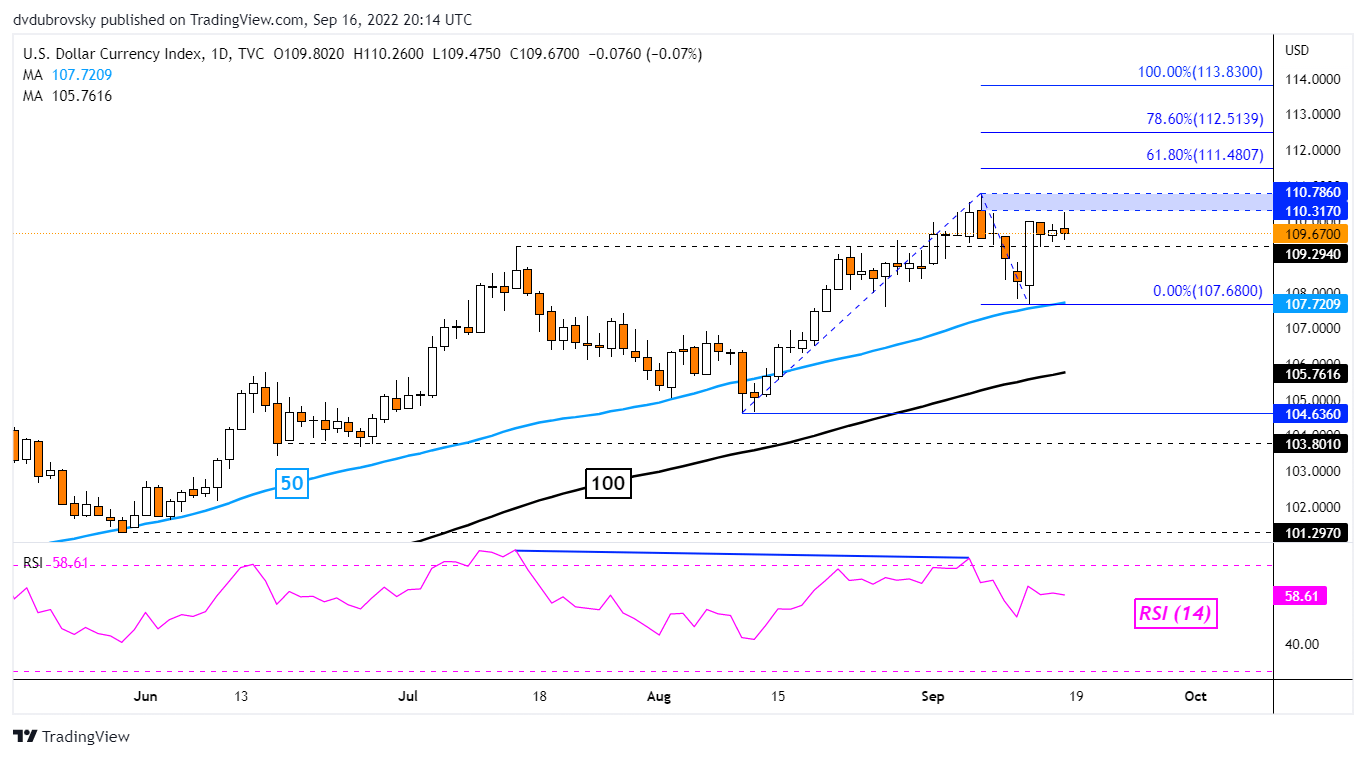
DXY Daily Chart
Switching to the DXY daily chart, we can take a closer look at where key resistance is. This appears to be the 110.317 – 110.786 zone. The latter is made up of September 7th highs. Clearing this range would open the door to resuming the uptrend. That exposes the 61.8% and 78.6% Fibonacci extensions at 111.48 and 112.51, respectively. In the event of a turn lower, immediate support appears to be the 109.29 inflection point. Further losses subsequently place the focus on the September 13th low at 109.29. This is also where the 50-day Simple Moving Average (SMA) may kick in, maintaining the dominant upside focus. If not, the 100-day SMA would likely be the next key level below.

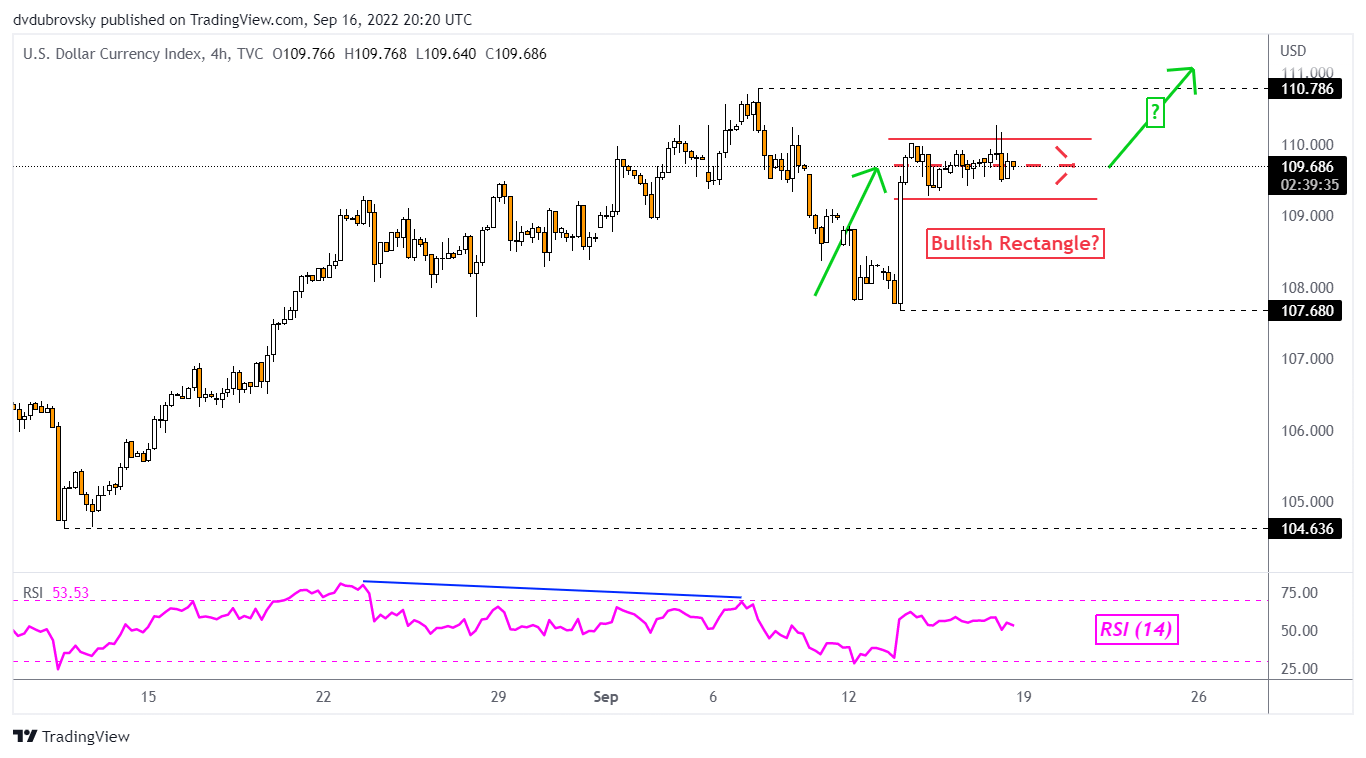
DXY 4-Hour Chart
For a more immediate picture of what we could expect in the coming sessions, we can look at the 4-hour chart. The DXY index appears to be trading within the boundaries of a Bullish Rectangle chart formation. Clearing the ceiling and confirming the breakout may open the door to uptrend resumption towards 110.786. Otherwise, a turn lower places the focus on 107.68. On balance, the technical posture continues to hint at a cautiously bullish bias.
--- Written by Daniel Dubrovsky, Strategist for DailyFX.com
To contact Daniel, use the comments section below or @ddubrovskyFX on Twitter
Trade Smarter - Sign up for the DailyFX Newsletter
Receive timely and compelling market commentary from the DailyFX team


