


DOLLAR INDEX (DXY) TALKING POINTS:
US DOLLAR TECHNICAL FORECAST: NEUTRAL
- DXY Sees Whipsaw Price Action to Close the Week on a Three-Day Losing Streak.
- Break of the Inverted Head and Shoulder Pattern Lacked Follow Through.
- DXY Remains Bullish Without a Daily Candle Close Below the 104.30 Handle.
- USD/CAD Over Extended Following Range Breakout… Doji Candle Close Hints at Potential Early Week Retracement.
Trade Smarter - Sign up for the DailyFX Newsletter
Receive timely and compelling market commentary from the DailyFX team
US DOLLAR OUTLOOK
The US Dollar enjoyed some whipsaw price action this week with Fed Chair Powell’s testimony and Friday’s NFP report seeing contrasting market reactions. On Tuesday Fed Chair Powell began his two-day testimony in Washington DC regarding Fed Monetary Policy and Tuesday in particular saw the Dollar rally as well as expectations rise for a higher peak rate from the Fed in 2023. Markets also adjusted their expectations for the Fed’s upcoming March meeting with the Probability of a 50bps hike reaching a high of 76% ahead of Friday’s Jobs report.
Powell was quick to stress the importance of the data moving forward, reiterating that no decision had been made regarding the Fed’s March meeting and I think Fridays NFP report proved just how important high impact US data releases continue to be. Fridays NFP report beat estimates with a print of 311k yet unemployment ticked higher and average hourly earnings lower with the latter two data points seemingly holding more weight. The market reaction proves this as we saw the DXY declined significantly while any gains made by dollar denominated pairs rising, some even higher than the prices they traded at prior to Powell’s testimony. The probability of a 50bps hike by the Fed in March also dropped with market participants now favoring a 25bps hike once more. The Dollar Index (DXY) looks on course for its biggest daily drop since February 1.
Introduction to Technical Analysis
Technical Analysis Chart Patterns
Recommended by Zain Vawda
Looking at the week ahead we have a host of high impact US data events which could affect the DXY as data releases at the moment are driving moves a lot more than the technicals are. This makes a long-term technical outlook tough as all eyes turn toward the inflation data out of the US next week. The question is was this week’s slight dip in average hourly earnings the first sign of a potential drop in next week’s inflation print?
TECHNICAL OUTLOOK
US Dollar Index (DXY) Weekly Chart

Source: TradingView, prepared by Zain Vawda
From a technical perspective, the weekly chart for the dollar index (DXY) is on course for a second bearish week in succession. The weekly candle is also eyeing a shooting star or doji candle close which hints at further downside in the week ahead.
US Dollar Index (DXY) Daily Chart, March 10, 2023.
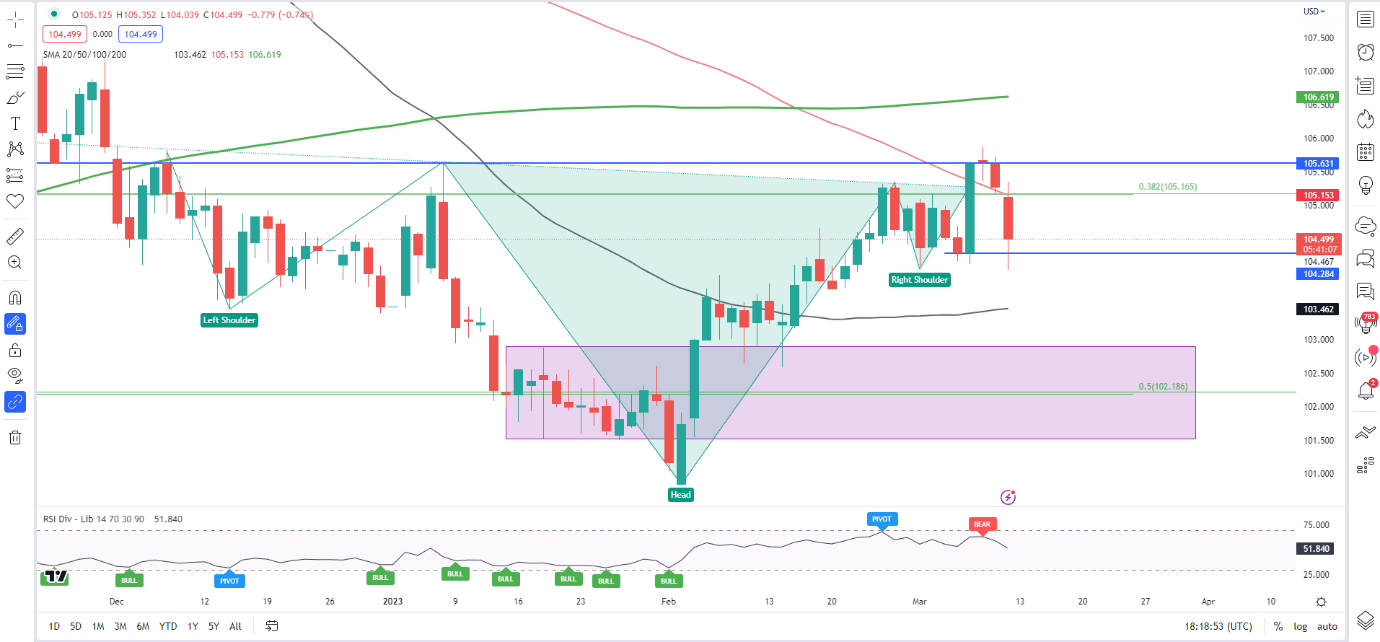
Source: TradingView, prepared by Zain Vawda
On the daily timeframe we had an inverted head and shoulders pattern in play with the DXY breaking the neckline on and the 100-day MA on Tuesday. Since then, we have seen a doji candle close followed by Thursdays push lower and Friday’s continuation which is set to be the largest single day drop in the DXY since February 1.
The daily candle is currently flirting with the support level at 104.30 with a close below increasing the probability of further downside in the week ahead. This would likely bring the 50-day MA back into play around the 103.50 handle and potentially the top of the range we broke out of in early February around the 102.90 mark.
Alternatively, a close above the support area at 104.30 could see a push higher back toward the 100-day MA just above the 105.00 handle and this week’s high at 105.80. Any move higher will have the 200-day MA to contend with which currently rest at the 106.60 handle.
All in all, we could be in for another interesting week for the dollar index given the amount of high impact US data we have on the cards which could whipsaw price action prevail once more with either early week strength followed by weakness later in the week or vice versa.
USD/CAD TECHNICAL OUTLOOK

Source: TradingView, prepared by Zain Vawda
USDCAD made a solid advance this week aided in part by the policy divergence developing between the US Federal Reserve and Bank of Canada. USDCAD finally broke out of the range it had been stuck in since November 4, printing a daily candle close above the range high of 1.3700 on Tuesday. We have since seen price advance with a weekly high of 1.38620 before Friday’s bout of USD weakness halted the rally. Friday’s daily candle looks set to close as a doji hinting at the potential for an early week reversal.
The fact that we haven’t retested the top of the range since breaking higher means any early week pullback could see us retest the 1.3700-1.3650 level before continuing higher. Resistance to the upside rests at the 1.3900 level and above that the next resistance level lies at 1.3970 area which is also the 2022 high. USDCAD remains bullish as long as price remains above the 1.3580 level.
Introduction to Technical Analysis
Learn Technical Analysis
Recommended by Zain Vawda
RESOURCES FOR TRADERS
Whether you are a new or experienced trader, we have several resources available to help you; indicators for tracking trader sentiment, quarterly trading forecasts, analytical and educational webinars held daily, trading guides to help you improve trading performance, and one specifically for those who are new to forex.
--- Written by Zain Vawda for DailyFX.com
Contact and follow Zain on Twitter: @zvawda


