


USD, SPX, Gold Talking Points:
- Today is the last trading day of 2022 and the stage is set for more volatility in Q1.
- The S&P 500 held support at a major spot yesterday and the US Dollar is testing its own major support today. Gold prices continue to show breakout potential as Gold bulls have held a series of higher-lows.
- The analysis contained in article relies on price action and chart formations. To learn more about price action or chart patterns, check out our DailyFX Education section.

Today marks the end of 2022 and for many, this probably couldn’t have come soon enough. Bear markets have become an abnormality in the post-GFC backdrop as Central Banks have started to use bond buying programs to keep yields artificially low. And with inflation not presenting much of a problem, banks were able to accumulate trillions of debt on balance sheets with little worry.
The first major attempt at normalization fell flat but that was perhaps in-part to an overzealous Fed in 2018, which hiked rates seven times in 2017 and 2018 after not having raised rates for more than nine years until finally hiking by 25 bps in December of 2015. The bank was also starting QT or the process of unwinding the massive portfolio that had built during multiple rounds of QE. But markets showed a stark adverse reaction in Q4 of 2018 until, eventually, the Fed started to soften their stance.
And its this very dynamic that’s still playing a role today: Markets have become accustomed to the Central Bank stepping in with looser policy any time a major economic threat has shown. And sure, if inflation is below 2% and there’s an impending threat, it makes sense to play defense. But when inflation is elevated and that very response could create an even larger worry – priorities begin to change. And that’s what this year was, the Fed taking a very different tact to even when we had seen last year, when they continually dismissed rising inflation as a ‘transitory’ idea.
In stocks, that theme played out very visibly this year. Despite the S&P 500 being down about 20% on net for 2022, there were multiple swings, in both directions, as price action displayed a ‘two steps down, one step up’ type of pattern throughout the year. This also highlights the important role of sentiment as a heavily-shorted market makes continued downside a more difficult prospect. Because if anyone that wants to sell is already short (or flat of long positions) – then who else is going to offer supply to help push price down even more?
For next year the Fed remains hawkish. How much remains to be seen. Inflation remains elevated and it seems that they have to address this first before any other concerns can be prioritized. Because with high inflation comes a lack of flexibility and ability to address problems as they arise, the Fed must keep policy tight until they’re convinced that the job is done.

S&P 500
The S&P 500 built a massive falling wedge formation this year. Falling wedges are often approached with the aim of bullish reversals and they can even take on the form of a bull flag, highlighting a pullback in a bullish trend before continuation potential might come back into the equation.
It’s important to note here: Not all formations come to fruition. The point of tracking formations isn’t to predict the future because they’re simply based on the past. The idea is to get a probability and what’s showing in the S&P highlights that fact.
This setup shows how bears didn’t have much luck at fresh lows this year, especially at extremes. Bears remained aggressive upon tests of resistance, such as we saw in December when price flickered above the resistance trendline of the formation. But, price quickly snapped back and at this point, appears settled to move into the end of the year with a support hold at the confluent spot around 3800.
S&P 500 Daily Chart
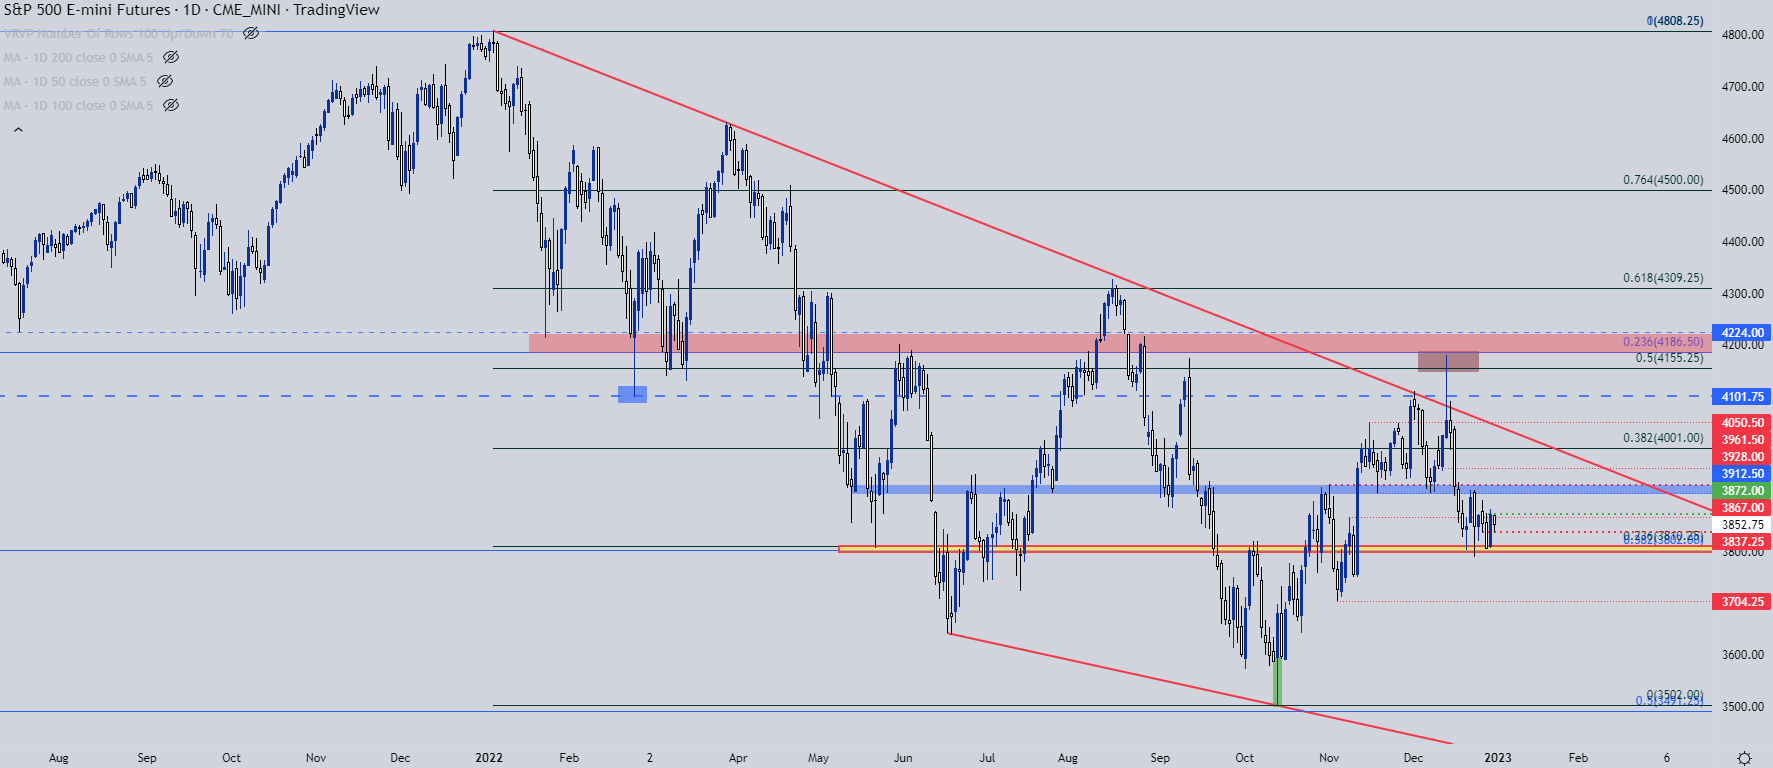
Chart prepared by James Stanley; S&P 500 on Tradingview
S&P 500 for 2023
One scenario that could remain of interest would be another test of the lows, this time sub-3500, followed by another bullish response, similar to what showed up in October. With that, the falling wedge can remain in-play and unless a collapse-like move shows up in stocks rather soon, the wedge will retain some workable context.
As for next support levels – the pre-pandemic swing high at 3400 remains of interest and there’s a spot of confluence around 3200.

S&P 500 Weekly Chart
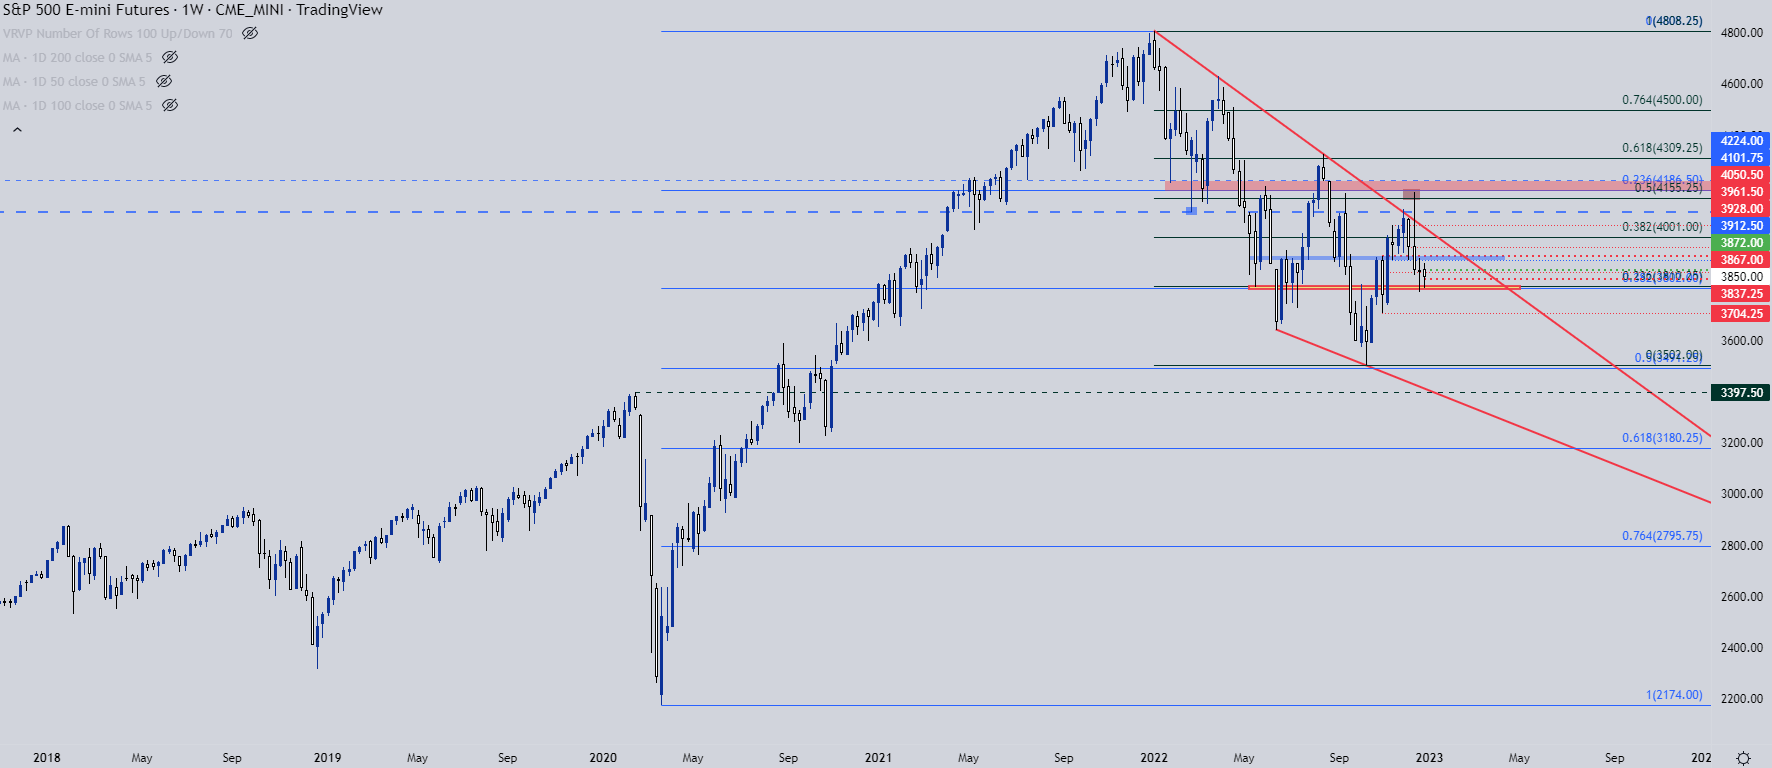
Chart prepared by James Stanley; S&P 500 on Tradingview
USD
It was really a tale of two trends in the USD this year. The first nine months were intense strength and Q4 was a massive pullback to that theme. This did keep the USD on the move for much of the year which for traders is a great thing. The bigger question remains around direction and given the way that 2022 played out with rates amongst central banks, the prospect of continued volatility remains.
The Fed and ECB have both told markets that more hikes are on the way and the Bank of Japan may be nearing a point-of-change on the horizon as inflation has pushed up to 40-year-highs.
Perhaps the point that was obscured in the first nine months of the year was the risk of impact from such significant slides in the Euro or British Pound. With currencies, balance is important because there are consequences, mainly on the front of inflation. And for Europe who was already struggling with inflation to watch the single currency fall with such force, the prospect of even more inflation kept markets on the edge of their seats.
So the pullback in EUR/USD in Q4 is a welcome sight to anyone that enjoys some form of economic stability. The bigger question is whether it can last as the ECB is in a very difficult position, forced to raise rates even with recessionary potential showing.
At this point, the USD is testing support at 103.82. This was the swing high in 2017 and started to come in as support a couple of weeks ago, just after CPI was released in mid-December. For next year, support potential remains at the bullish trendline projection, around the 103.00 handle in DXY; and there’s some confluent Fibonacci support a little lower, around the 102 handle.
To read more about the US Dollar, check out my article from yesterday on US Dollar Price Action Setups.
US Dollar Weekly Price Chart
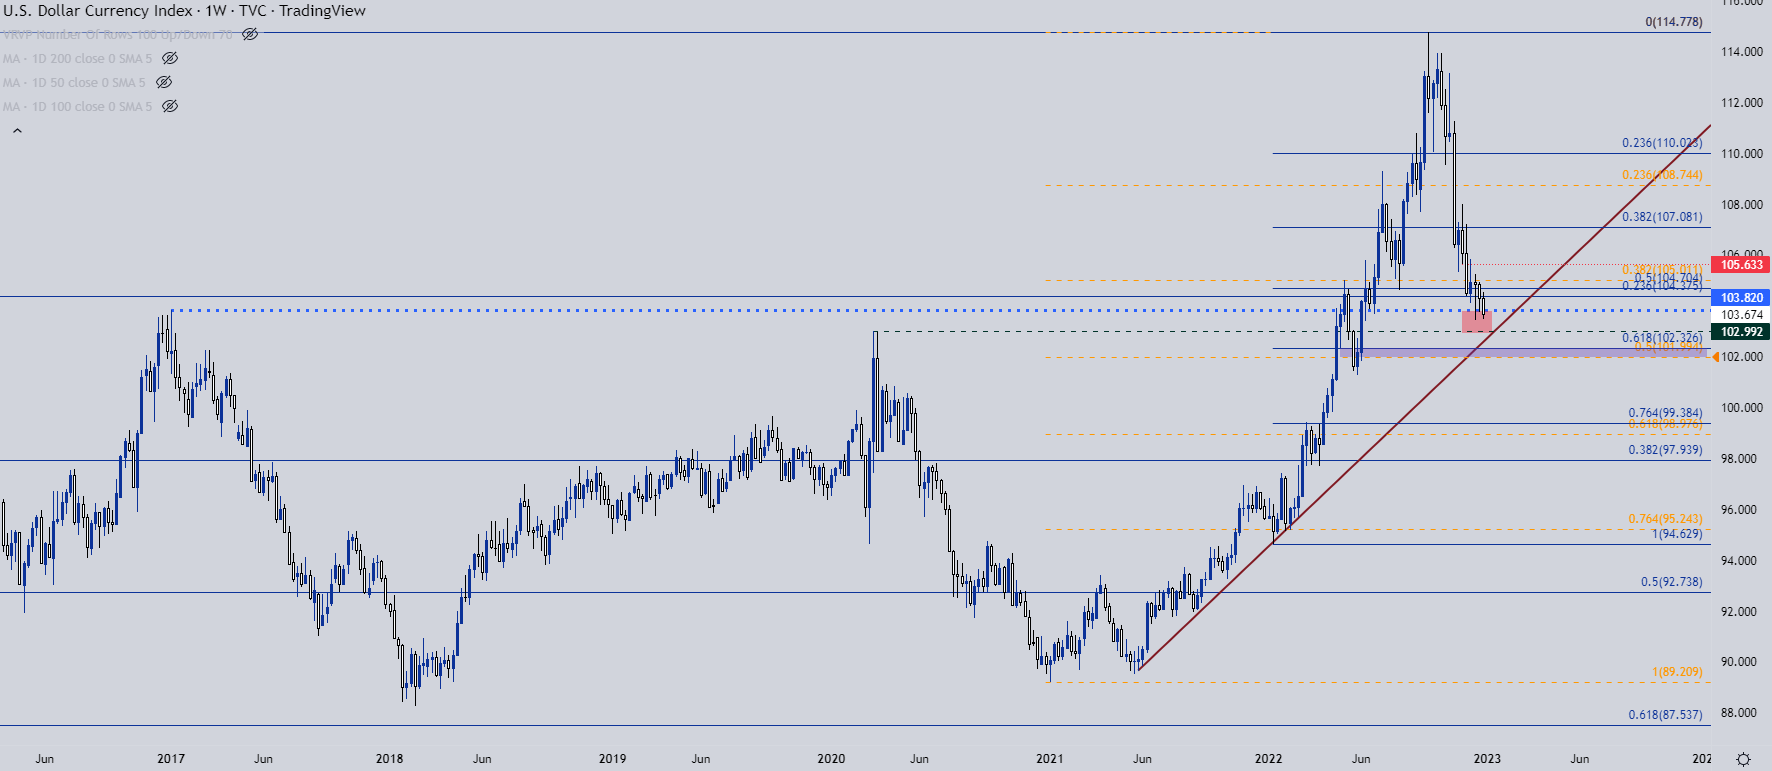
Chart prepared by James Stanley; USD, DXY on Tradingview
Gold
On that topic of wedges, there was a falling wedge that played out in Q4 in Gold. Gold prices came into the quarter threatening a deeper breakdown and with the freight train of the USD playing a role, there was even a fundamental backdrop for such.
But the month of October saw bulls take a stance, digging in their heels at support around the 1620 spot. Three failed breakdown attempts eventually led to the bullish reversal and in the last two months of the year Gold wiped out almost half of the 2022 sell-off.
I remain bearish on Gold going into next year but the near-term price action doesn’t support that thesis yet. There is a resistance zone a little bit higher, from around 1848 up to 1872, and a show from sellers here could start to re-open that door for bearish swings.

Gold Weekly Price Chart
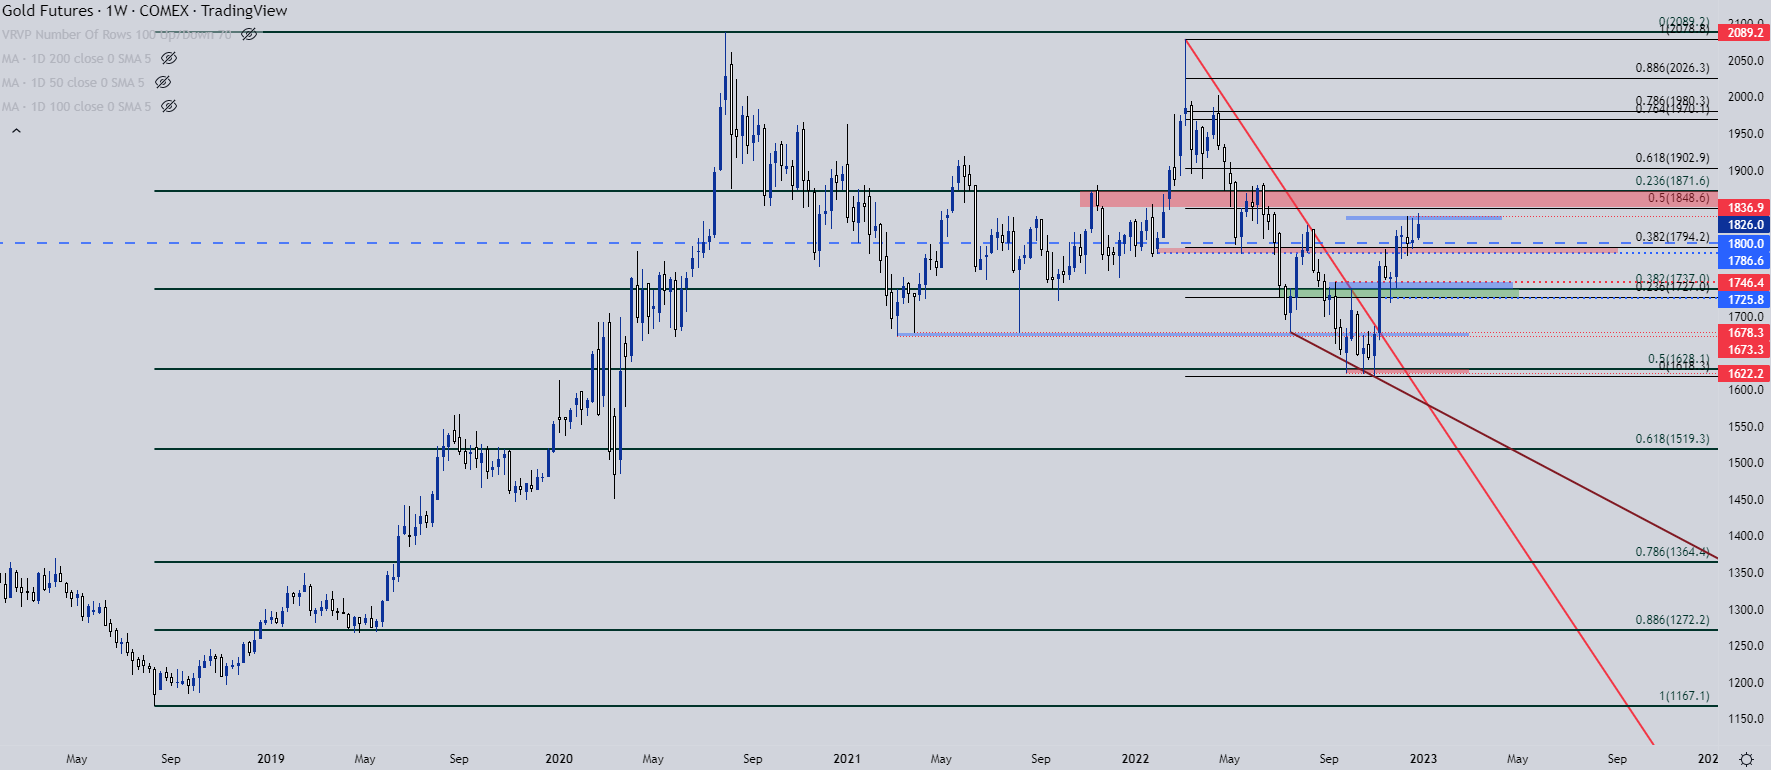
Chart prepared by James Stanley; Gold on Tradingview
--- Written by James Stanley
Contact and follow James on Twitter: @JStanleyFX


