


Gold Talking Points:
- Despite a continued surge in Treasury yields through the month of October, Gold bears were unable to break much fresh ground, getting caught at the same spot that set support in late-September.
- Bears inability to breakdown to fresh lows has allowed for the build of a falling wedge, and there’s also a possible double-bottom formation at play, which would be nullified by a breakdown if sellers can take-control over the next few days with FOMC and NFP on the radar.
- The analysis contained in article relies on price action and chart formations. To learn more about price action or chart patterns, check out our DailyFX Education section.

Deduction can be a powerful tool in analysis. If the door is wide open for bears to run through – and they don’t – well there just might be a reason for that. And this may highlight a greater potential for pullback, with ‘may’ being the key point of emphasis. This explains Gold prices in the month of October, when September brought a breach of a long-term double top formation that opened the door for a larger move-lower.
Within the backdrop the source of that bearish drive even remained to a large degree, with US yields continuing their ascent for much of last month. But Gold prices held the lows around the same level that came into play in late-September and, at this point, that begins to set up a possible double bottom formation which is something that could support a larger reversal scenario.
That said – bears can still make a statement here but that would require nullifying the double bottom, which can happen if sellers are able to push a breakdown to fresh lows. And with the Fed on the radar for tomorrow and NFP on the calendar for Friday, that potential certainly exists.
The current line in the sand for Gold is at 1622.
Gold Daily Price Chart

Chart prepared by James Stanley; Gold on Tradingview
Gold Prices Longer-Term
Sellers have been in-control of Gold price action for much of the past ten months, and in September, this lead to a breach of a long-term double top formation.
The neckline for that formation had come into play multiple times since early-2021, and I’m tracking that area from 1671 up to the psychological level at 1700. From the weekly chart, we can see the build of a falling wedge as that support has started to come into play, helping to buffer the lows even as bears have remained aggressive near resistance or at tests of highs.
This area started to come into play in July and was quickly back in the picture in September, finally giving way later in the month. One of the big drivers of that theme was the August 26th appearance from Jerome Powell at Jackson Hole, where the head of the FOMC took on a very hawkish tone with markets.
Might we be nearing a repeat? Or – will the Fed take a softer touch at tomorrow’s rate decision? Once again the focus will be on Powell’s speech as tomorrow is not a quarterly meeting and there will be no updated forecasts from the FOMC.

Gold Weekly Price Chart
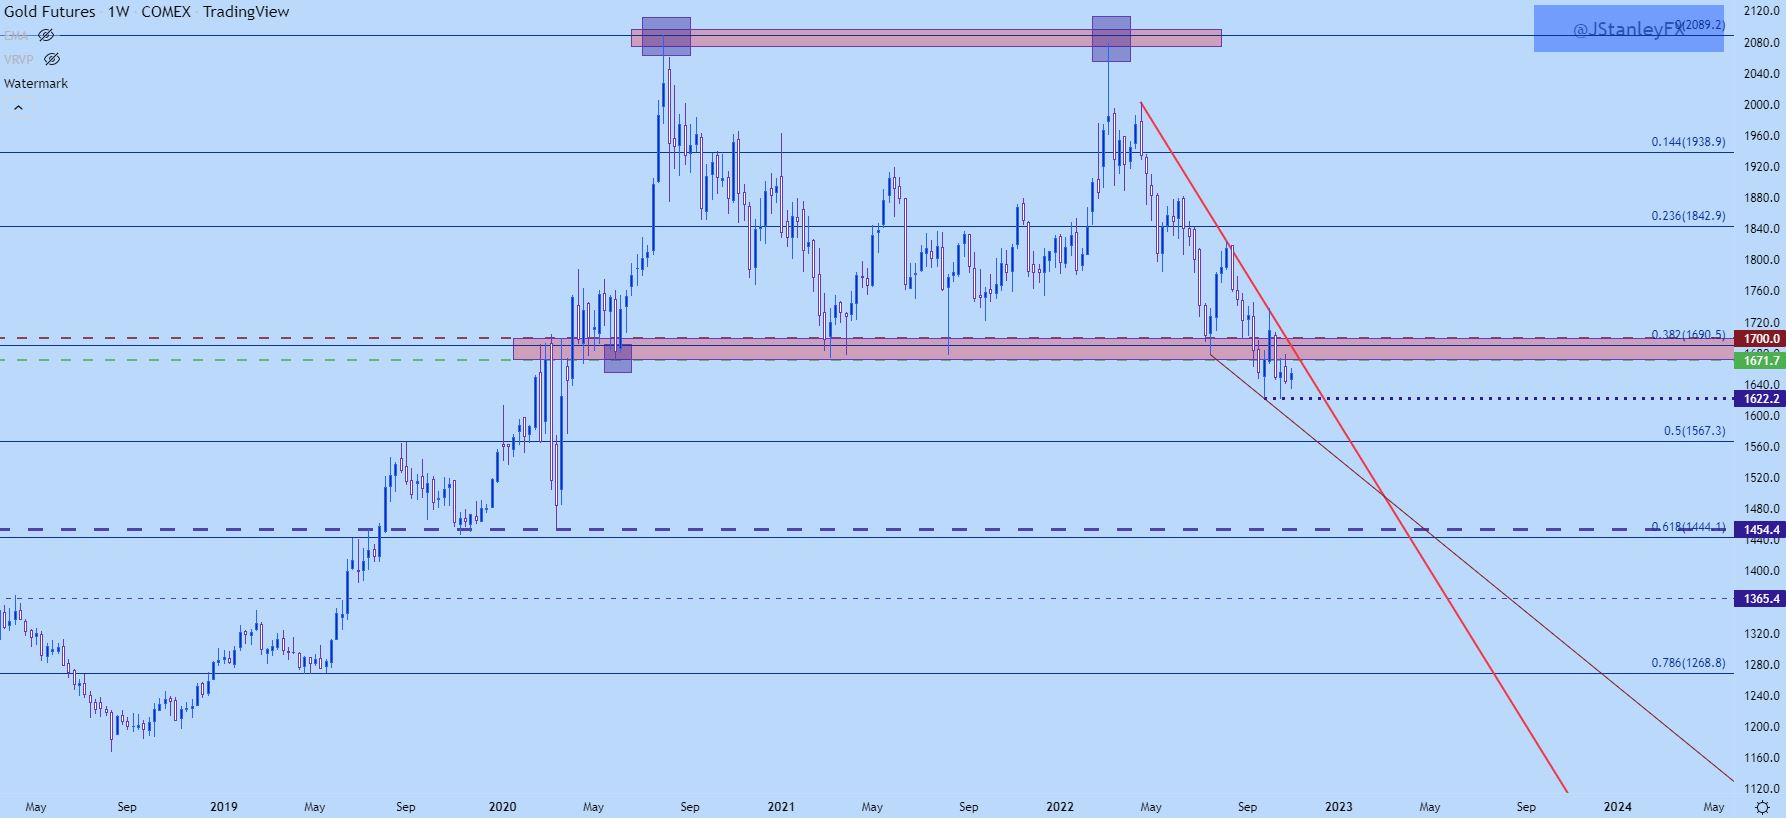
Chart prepared by James Stanley; Gold on Tradingview
Gold Near-Term: Resistance
The major factor at the moment for topside approaches in Gold is the longer-term zone that sits overhead. Last week saw two separate tests in that zone and each time sellers responded, helping to push prices right back down.
At this point, however, prices appear to be trying to hold a higher-low around 1635, with respect to that spot of support at 1622.
From the daily chart below, we can get additional scope on the matter. The bearish trendline that caught the highs in October remains of interest and that currently projects to around 1690. If bulls can force a break above that and the 1700 psychological level sitting just above that, there could be scope for a deeper pullback move in the longer-term trend and this could expose areas like 1738. If they can’t, however, there may be an attractive spot to look for bearish trend resumption but this would need to illustrate some element of resistance actually coming into play at that spot first.
As discussed numerous times recently, gold bears have had a difficult time with bearish breakdown scenarios and looking to establish bearish exposure at or near resistance has appeared as a more fruitful path than trying to chase moves lower.

Gold Daily Price Chart
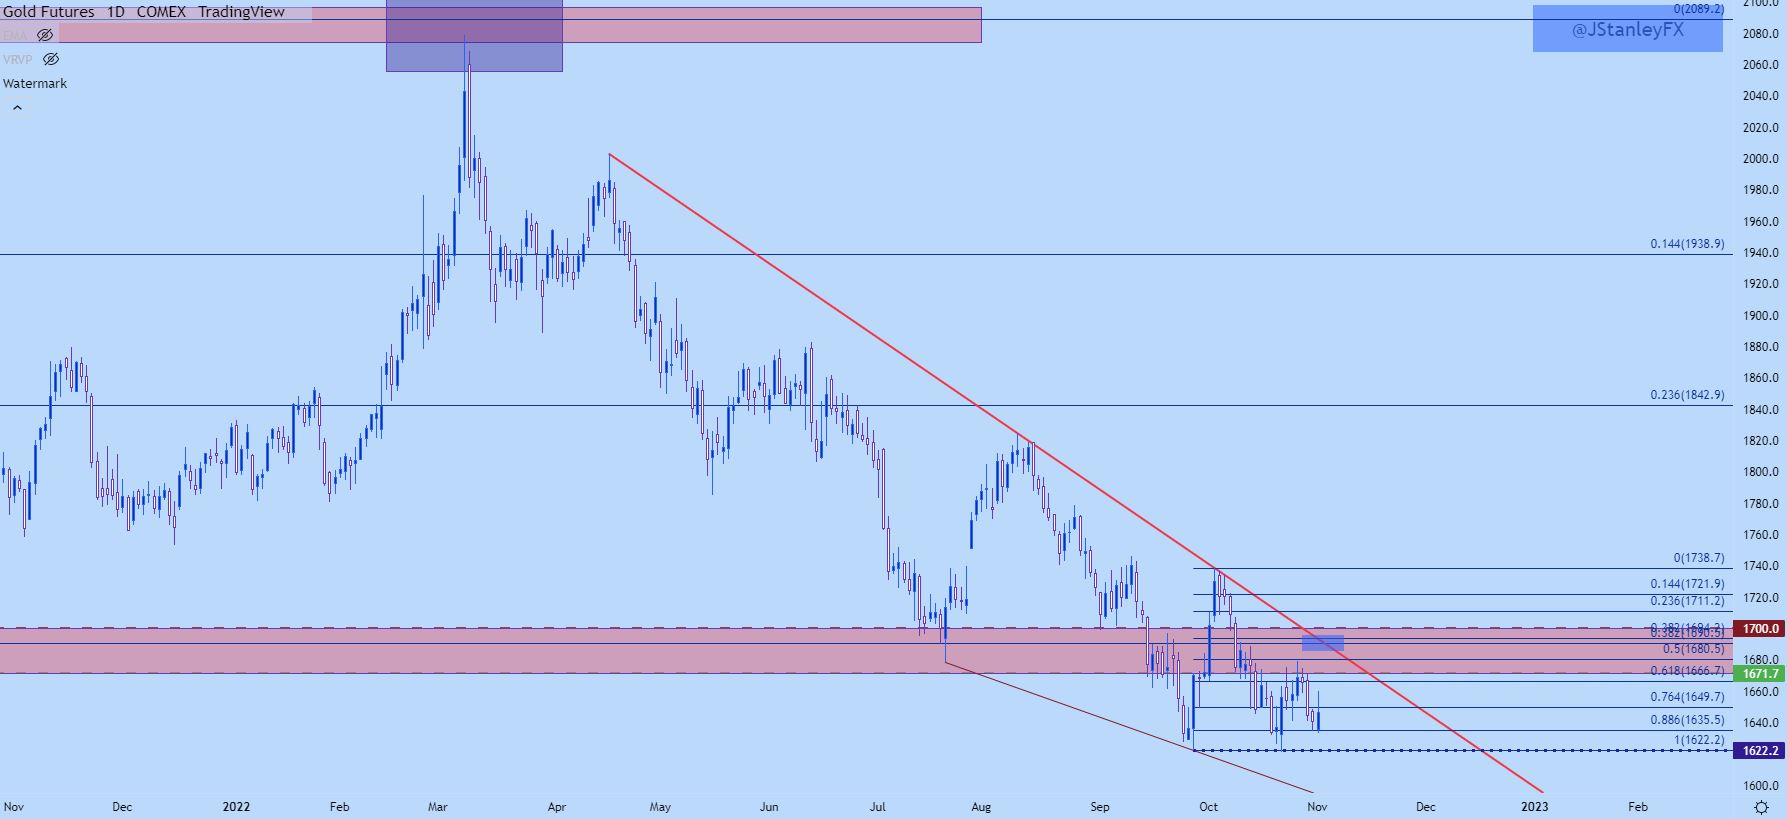
Chart prepared by James Stanley; Gold on Tradingview
--- Written by James Stanley, Senior Strategist, DailyFX.com & Head of DailyFX Education
Contact and follow James on Twitter: @JStanleyFX


