


Gold Talking Points:
- Gold prices technically set a fresh two-year-low last Friday, but it was a quick test of support that bounced into a bullish engulfing pattern on the daily chart.
- The big question around gold at the moment is whether there’s potential for another bearish breakdown, similar to what showed in late-September.
- Next week’s FOMC meeting will likely be key for that theme as US rate policy moves to center-stage.
- The analysis contained in article relies on price action and chart formations. To learn more about price action or chart patterns, check out our DailyFX Education section.

Gold prices have been in a bearish state for much of 2022 trade. And taking a longer-term look at the matter, there was a breach of a double top formation last quarter that keeps the door open for a bigger-picture bearish move as US rate policy gets more and more focus.
The Fed’s aim is to drain excess capital reserves from the banking system. And tighter monetary policy pushing higher rates increases the opportunity cost of holding non-yielding assets, such as Gold or perhaps even Bitcoin, and we’ve seen that dynamic playing out in both of those markets this year. While Gold is often looked at as a hedge against inflation, in reality, it’s a hedge against negative real rates, which the Federal Reserve is in the process of attacking right now with their continued rate hikes.
As long as the Fed is on this hiking track and rates are moving higher, Gold is vulnerable from a fundamental perspective, and that’s been matched by the technical backdrop in 2022 trade. As is common, however, timing those moves will remain a challenge which we’ll dig into after the next chart.
Gold Weekly Price Chart
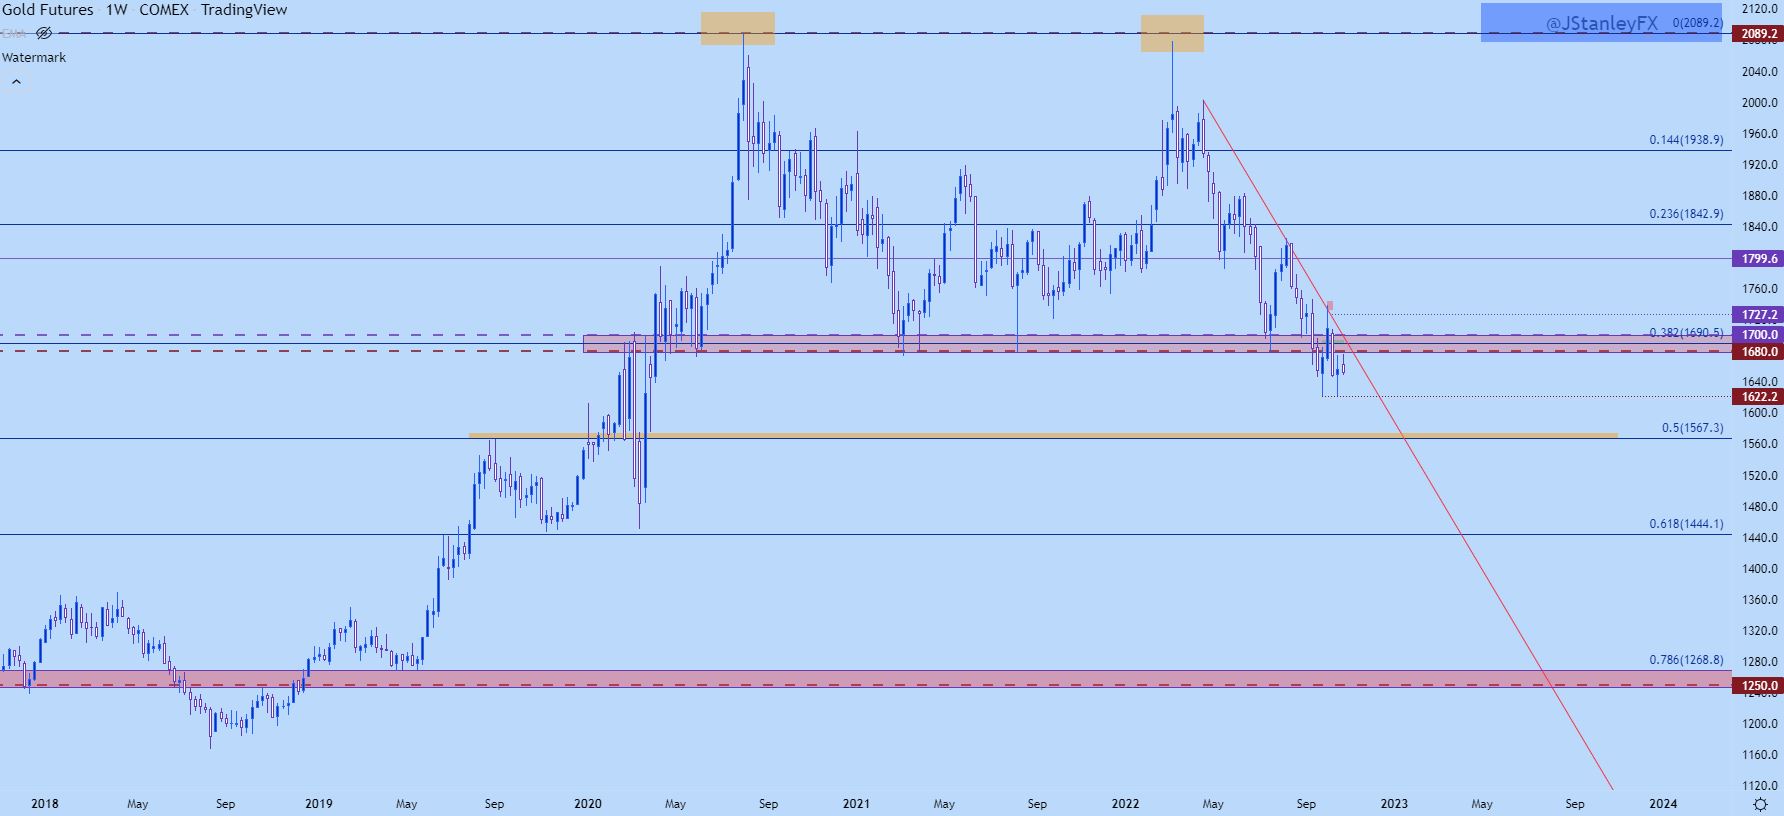
Chart prepared by James Stanley; Gold on Tradingview
Gold Shorter-Term
As I’ve been discussing in these pieces of late, breakout setups in Gold have had particular challenge. Last week is a great example of that, as Friday trade saw prices push down to a fresh low- albeit barely – before ripping higher.
Generally speaking, for most strategy types, traders are going to want to look to sell resistance; not support. The exception, of course, is the breakout strategy but that’s seemed to be particularly problematic lately in Gold.
And considering that longer-term backdrop looked at above, the neckline for the double top formation is at a contentious area of the chart that had multiple inflections over the past couple of years. And it’s not going quietly into the night as its now started to show resistance in various ways, although traders would want to be careful of looking at that zone, running from 1680-1700, as any form of a cap in Gold prices just yet.
Early-October is a great example of this, as prices bounced from a fresh two-year-low (at the time) up to a resistance trendline connecting April and August swing highs. There was a three-day-grind right at this trendline in early-October and that led to another bearish push that ran all the way into last Friday, when that prior swing-low at 1622 came into play as support.
Gold Daily Chart
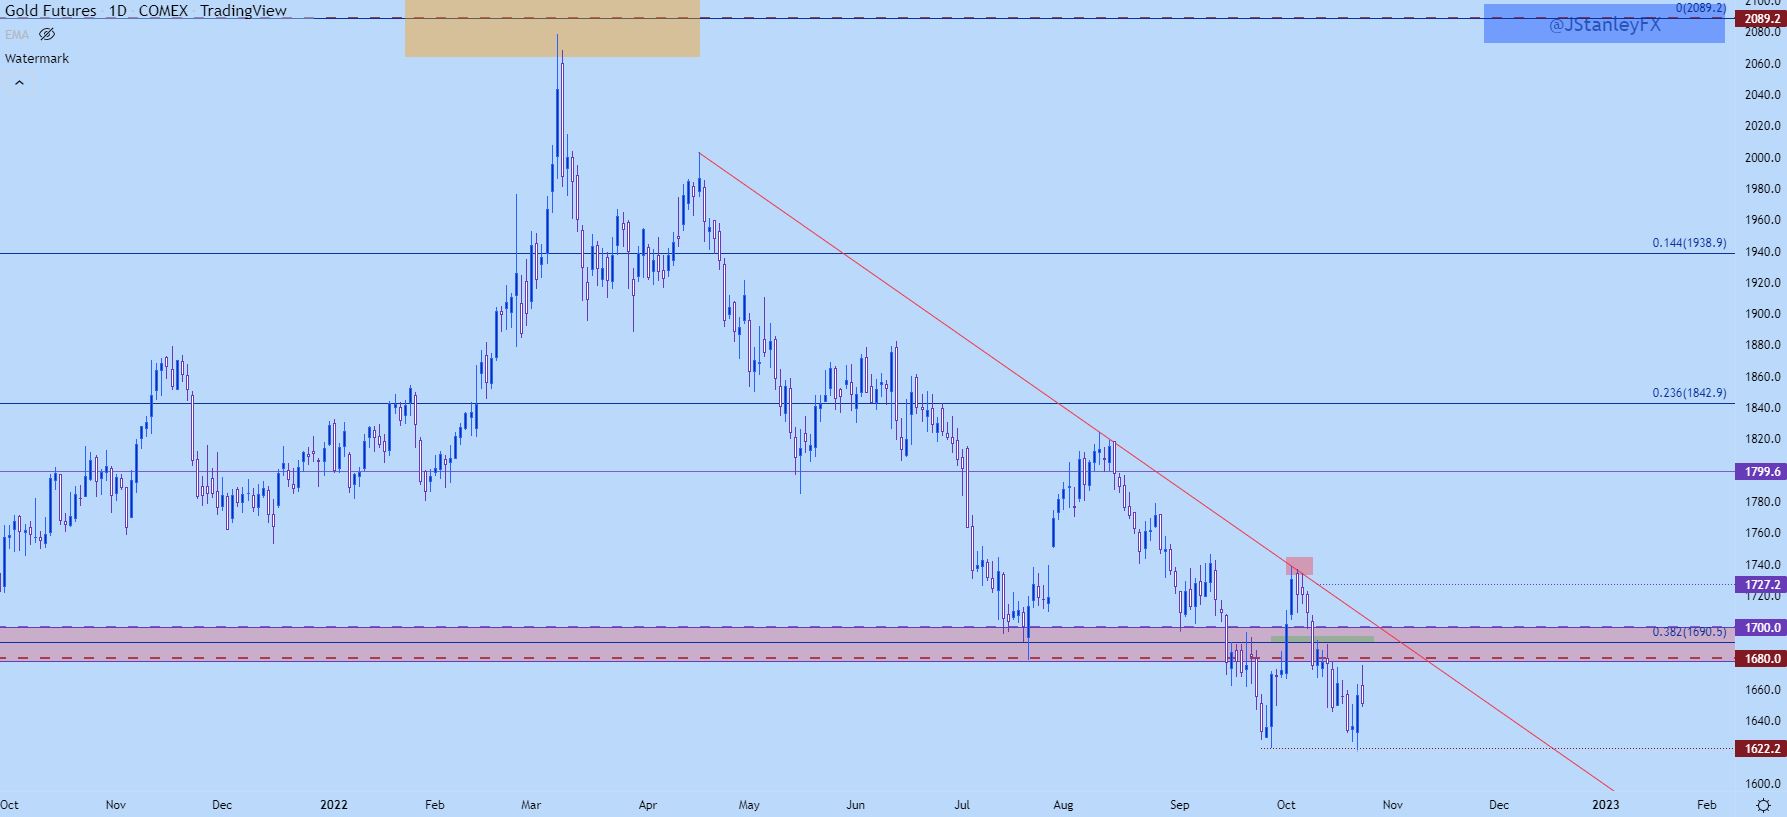
Chart prepared by James Stanley; Gold on Tradingview
Gold Resistance
At this point, from the four-hour chart, we have a recent higher-high in Gold. And prices appear to be trying to find support at a prior point of resistance, in a zone running from 1647-1650. That keeps the door open for a deeper move up to resistance, which I’m tracking from around 1680 which is the 50% mark of the recent major move as you can see from the below Fibonacci retracement.
Above that is a zone running from 1690-1694, and if bulls can force a move through that, the 1700 psychological level is getting close to confluent with the same bearish trendline that turned around the advance a few weeks ago.
And, taking a step back, something we now have to take into account after last week’s failed breakdown: A possible double bottom formation. The neckline in the formation would be the October high, all the way up at 1738. That makes for a $116 of difference from the bottom to the neckline of the formation, which would point to a possible move towards 1854. Perhaps not coincidentally – that 1854 level is a big one for Gold, as this was a support level that I was using for strategy back in May of this year before the bigger breakdowns really started to show.
That is just a possibility, however, and it doesn’t come into play unless bulls can trigger the formation which would require a break of 1738.7 to come into play. But, that would certainly be a move that would catch many off-guard. And, it may also better prepare Gold for a bigger-picture bearish scenario, which would remain alive until the longer-term double top is invalidated.
Gold Four-Hour Price Chart
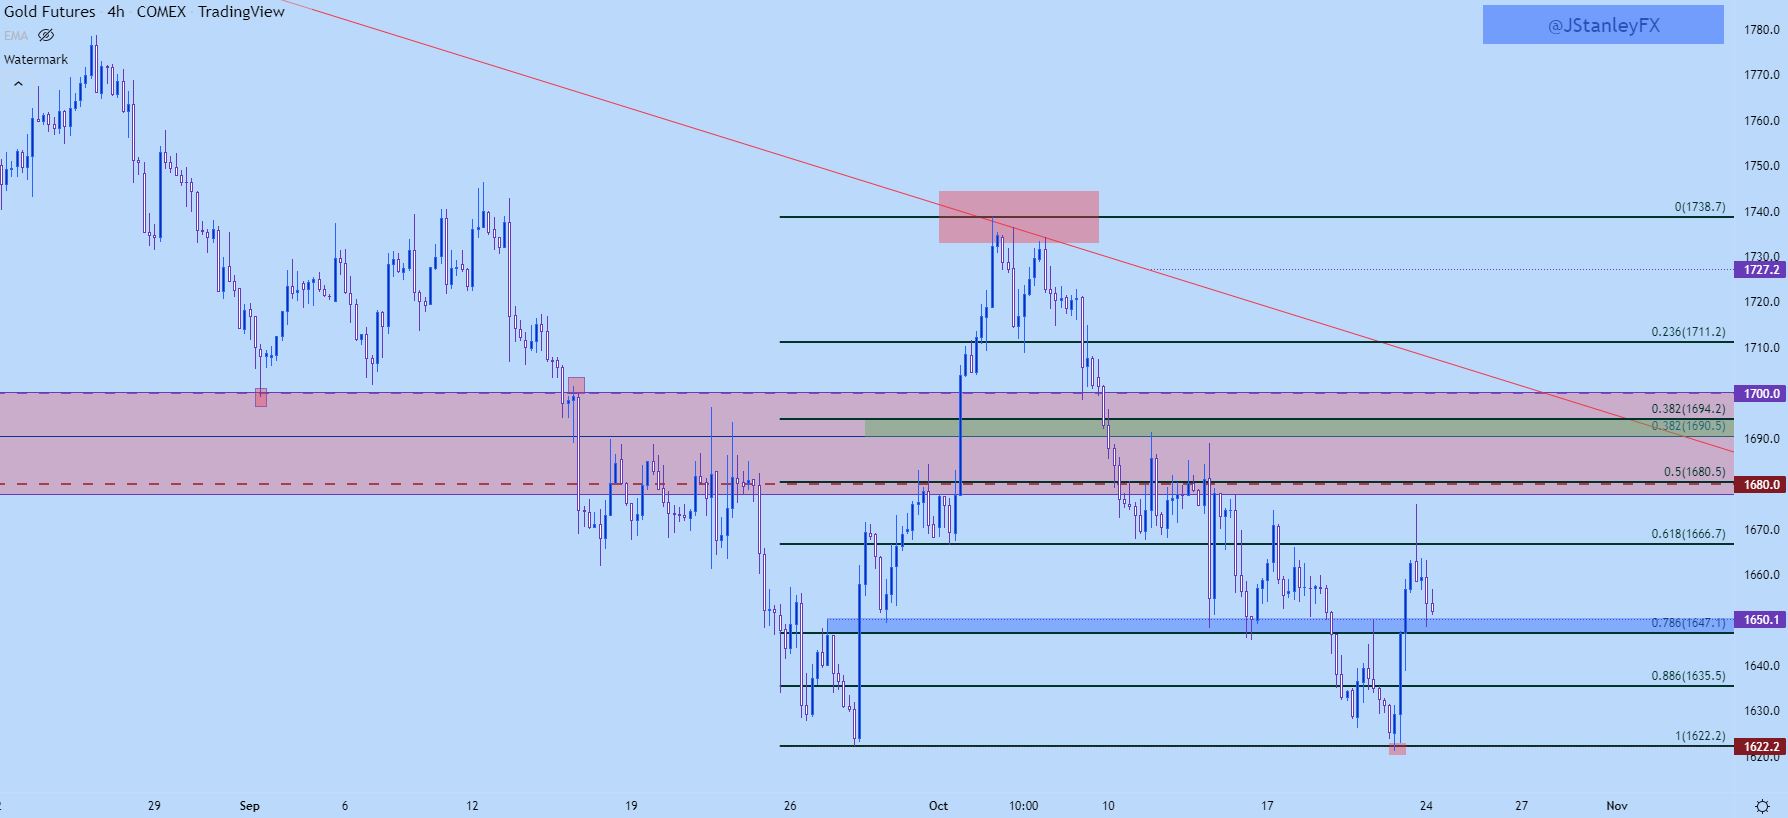
Chart prepared by James Stanley; Gold on Tradingview
--- Written by James Stanley, Senior Strategist, DailyFX.com & Head of DailyFX Education
Contact and follow James on Twitter: @JStanleyFX


