


Gold Talking Points:
- While stocks have started to attempt recovery from last week’s sell-off, even as US yields have remained strong, gold has continued to hold near recent lows.
- Last week saw bears make a pronounced re-entrance after two weeks of bounce around the Q4 open. The 1680 level helped to cauterize resistance but the big question now is whether sellers can continue the move.
- The analysis contained in article relies on price action and chart formations. To learn more about price action or chart patterns, check out our DailyFX Education section.

The past few days have seen consolidation in gold price action which runs in contrast to what we’ve seen in stocks, which was a strong bullish response after the S&P 500 printed fresh lows last Thursday. US yields have remained relatively strong and the 10-year is still threatening a breakout from the 4% marker. This doesn’t seem to be causing much alarm for equity traders at the minute as both the S&P 500 and Nasdaq have started the week with strong rallies. But, as looked at yesterday, given the Friday sell-offs that have become more commonplace, a Monday pullback from that move isn’t all that far out of reason.
In gold prices, however, there hasn’t been much for counter-trend movement of late. As looked at last week, the 1680 level remains a key spot for gold and this helped to hold resistance throughout last week, all the way into that Thursday CPI report at which point bears pushed down for a fresh lower-low. Support showed up at the 78.6% Fibonacci retracement of the recent bounce move, which has since helped to hold the lows; but a bearish trendline combined with that support makes for a short-term descending triangle that keeps the door open for short-term bearish breakouts, with aim towards 1635-1637 after which the two-year-low comes into play.
Gold Four-Hour Price Chart
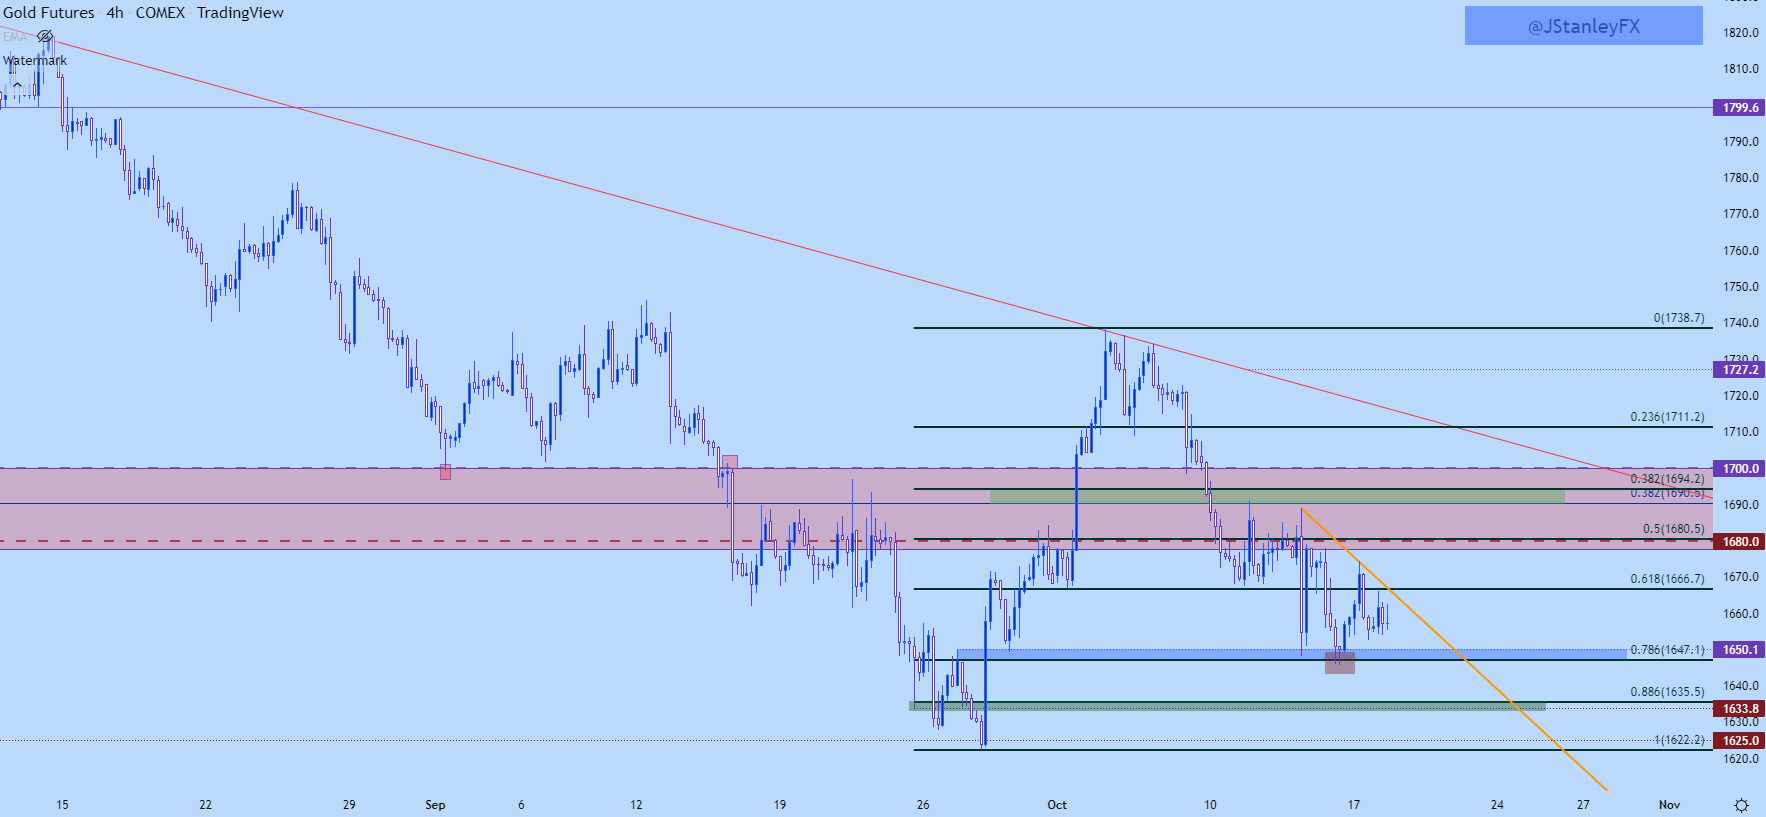
Chart prepared by James Stanley; Gold on Tradingview
Gold Alternative Scenarios
I’ve been talking about this in gold articles of late but the breakout strategy on bearish biases has seemed to be of particular challenge. And counter-trend moves, such as we saw develop in late-September/early-October can be vicious setups that last for a while, as that prior bounce ran for more than $100 in a little under a week.
For those looking to implement a bearish setup on gold, there’s a number of possible resistance levels to work with. On a very short-term basis, the Fibonacci level at 1666 is confluent with a bearish trendline. Above that, the same 1680 level from last week comes into the picture and there’s a short-term ‘r3’ zone of resistance up at 1690-1694, which caught the high early last week. If we see price action work above the 1700 psychological level, then we may be in for one of those deeper retracement types of scenarios.
Gold Two Hour Price Chart
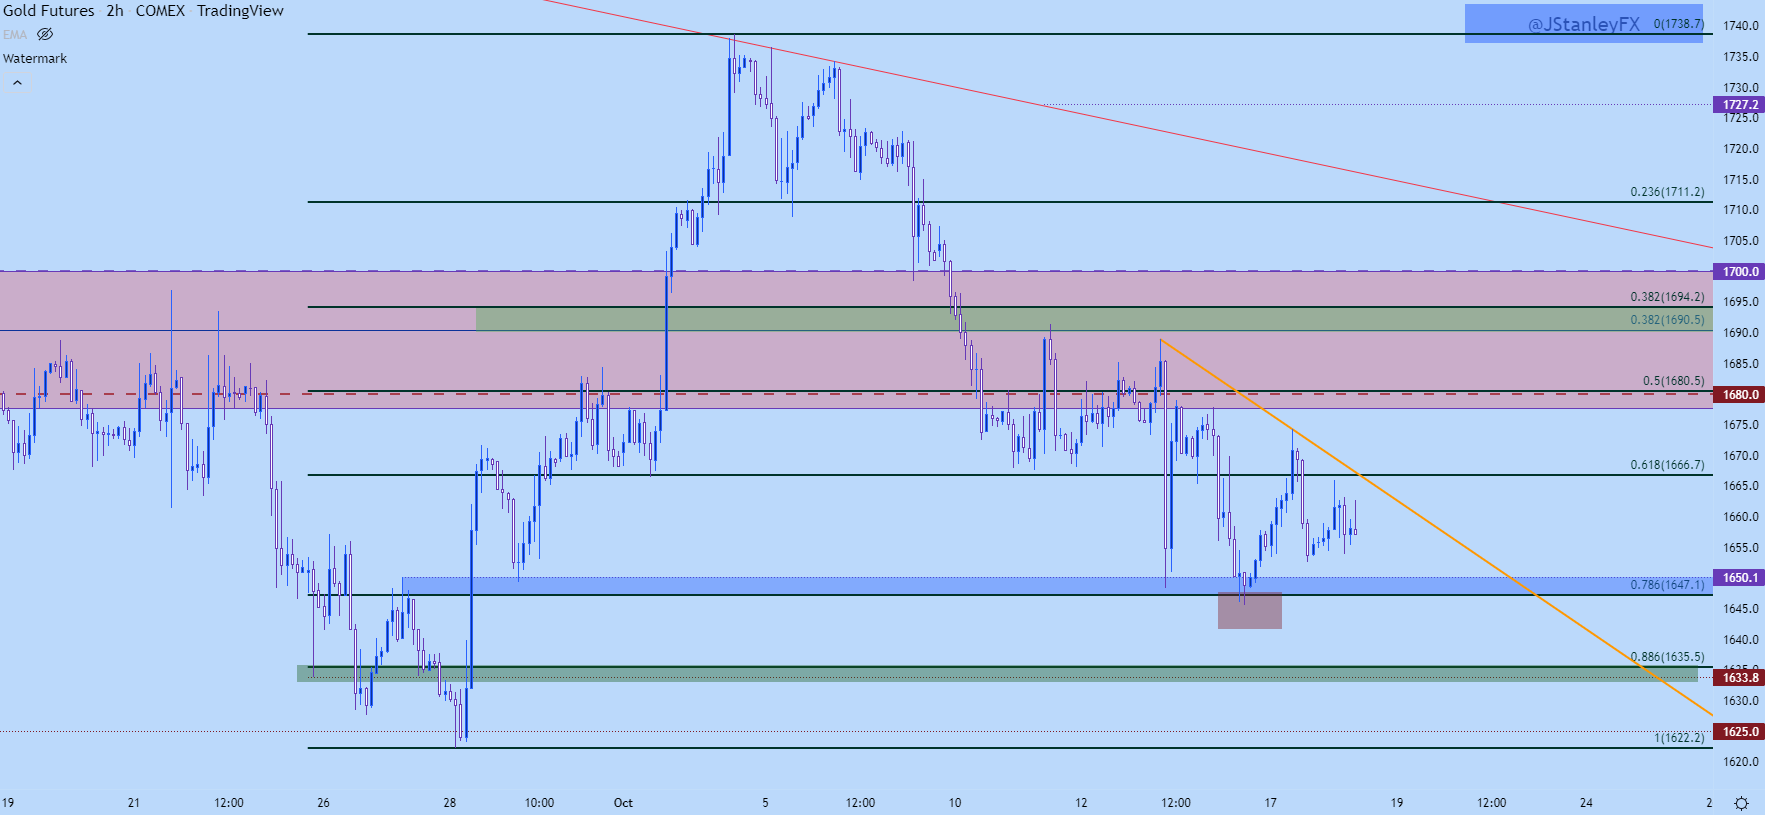
Chart prepared by James Stanley; Gold on Tradingview
Gold Big Picture
On a bigger-picture basis the backdrop for gold remains bearish. In late-Q3 trade a double top formation began to fill-in and that’s opened the door for a bigger-picture bearish theme in gold.
The support zone that runs from 1680-1700 was in-play for two years and thusly, it’s not going quietly into the night as we can see from the congestion that’s shown on downside breaks of late, along with a propensity for prices to pullback and test for resistance in that prior zone of support. This gives the appearance that we haven’t really seen capitulation yet as the door has only started to open on what could be the filling-in of a longer-term bearish theme.
Breaks of the two-year-low that was set in September opens the door for a move down towards the 50% mark of the 2016-2020 major move which plots at 1567. That price was also the 2019 high, so there’s some historical reference there, as well.
Gold Weekly Price Chart
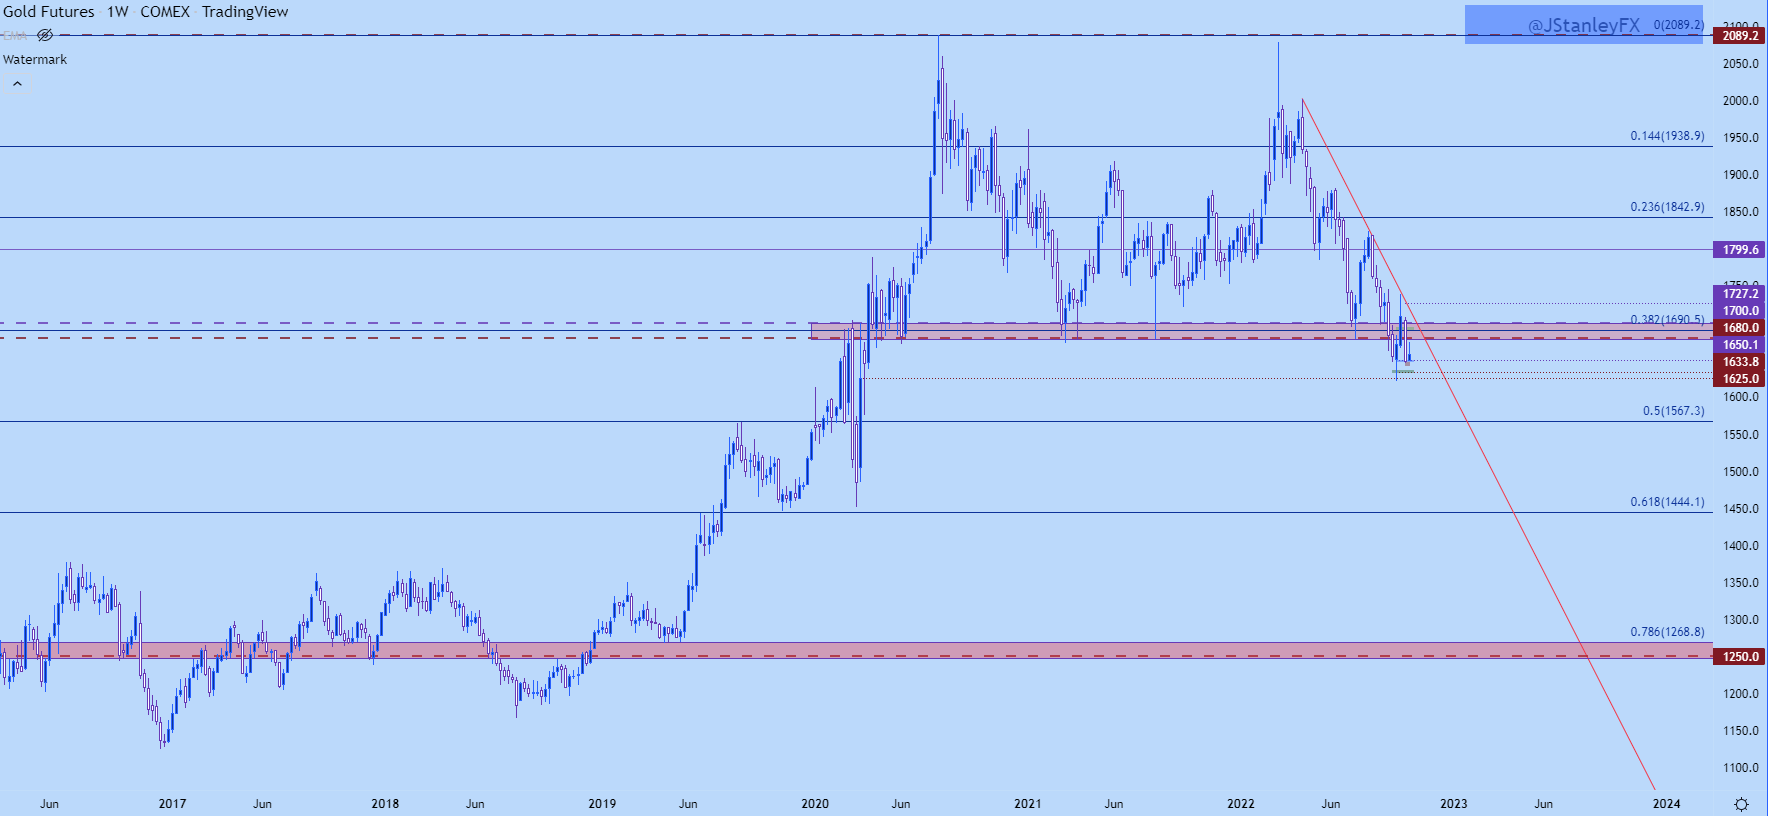
Chart prepared by James Stanley; Gold on Tradingview
--- Written by James Stanley, Senior Strategist, DailyFX.com & Head of DailyFX Education
Contact and follow James on Twitter: @JStanleyFX


