


Gold Talking Points:
- Gold prices broke down to a fresh two-year-low last week, testing below $1662 before catching a late-week bounce.
- Gold is now working on its sixth consecutive monthly loss, which correlates with the Fed’s rate hike theme for this year. Gold bears have grown louder and louder as the Fed has grown more hawkish.
- Sellers are back at it again this week and with the Fed expected to continue their hawkish path, the fundamental backdrop could continue to push bearish trends in Gold.
- The analysis contained in article relies on price action and chart formations. To learn more about price action or chart patterns, check out our DailyFX Education section.

Gold prices started last week sitting on a strong shelf of support but by the end of the week, gold had already set a fresh two-year-low.
The CPI report on Tuesday was undoubtably a major factor. Last Monday had even seen gold prices get a boost up to resistance at prior support. But when CPI printed above expectations and as markets started to build-in the possibility of continued hawkishness from the Fed, with perhaps even a 100 bp hike at this week’s rate decision, support continued to slide and gold prices pushed below the 1671 level that had previously helped to set the low back in March of 2021.
Gold Weekly Price Chart
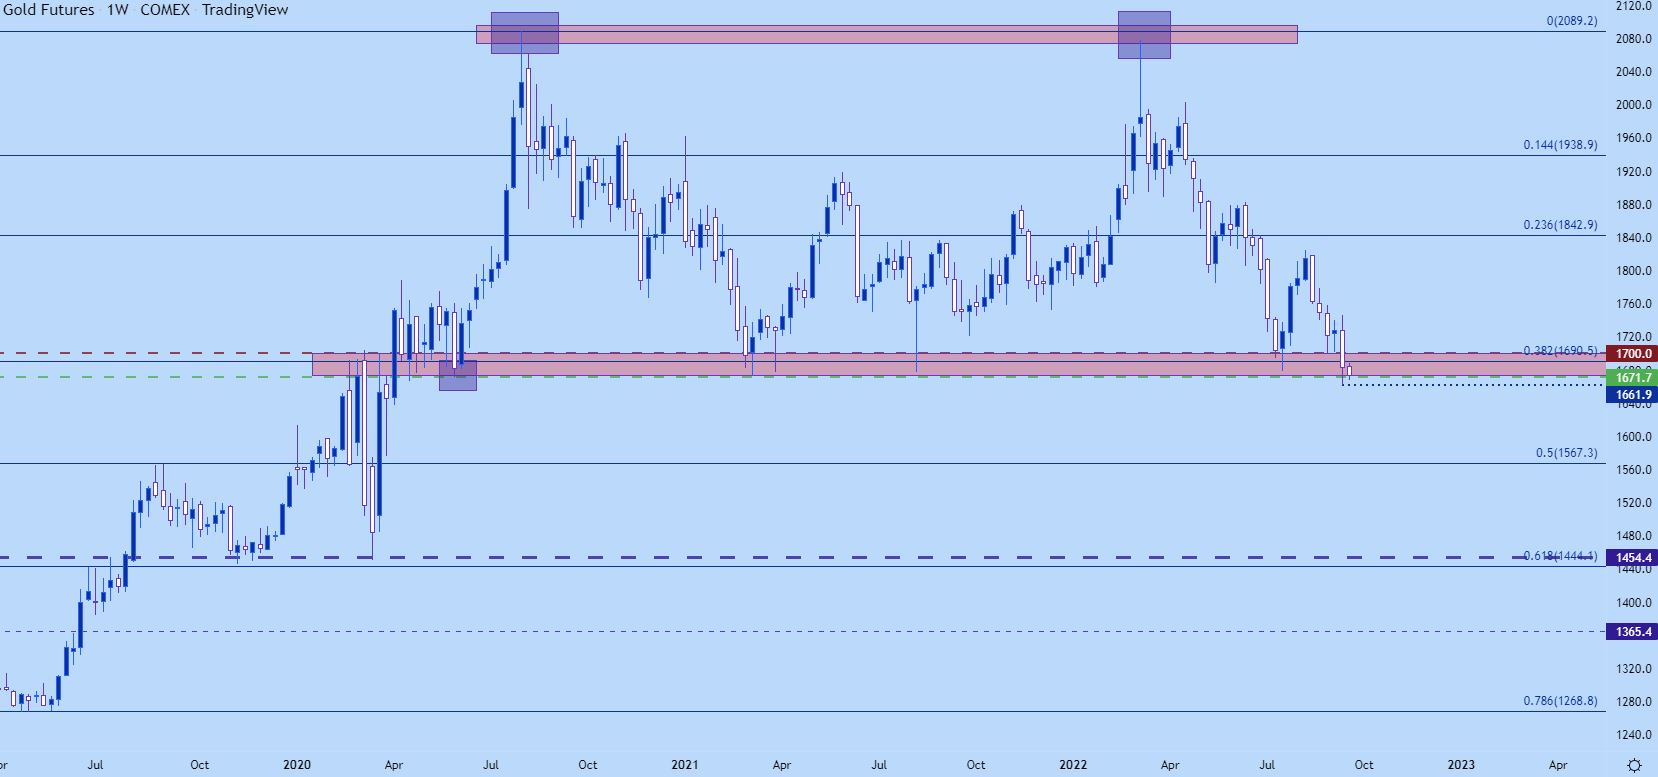
Chart prepared by James Stanley; Gold on Tradingview
Now, whether we get the 100 bp hike this week remains to be seen and per most estimates, that’s a distant possibility at this point. But, nonetheless, the fact remains that the Fed’s priority is fighting inflation and it looks as though they’re going to continue to hike and tighten until inflation is back under control – and for gold this is a bearish factor.
With negative real yields gold can be an attractive investment. Because, after all, negative real yields bring on currency debasement, right? The currency can purchase less on a relative basis due to inflation and for gold, this can be a positive as gold prices are based in that same fiat currency that’s being debased from negative real yields. When rates go up, however, there’s now an opportunity cost for holding gold – and that is the rate.
If investors can get 3% in a money market or 90-day T-bill, what’s the point in holding capital in a non-interest bearing asset such as gold? And even if you’re not thinking of that as a gold bull – others are – which can impact price action that, invariably, will impact your stance. So as rates go higher and higher, so does that opportunity cost for holding a non-interest bearish asset. So, the case to remain long must remain as very compelling or else, sellers will run…
This is why gold prices saw a precipitous decline in the early-80’s: As rates were hiked capital flowed into interest-bearing investments and away from gold. And as gold prices dropped, that bull case for holding capital in an inflation hedge, well that was being turned on its head and now investors were faced with the prospect of principal losses – on top of the lost opportunity cost of being invested in treasuries or money markets at somewhat attractive rates of interest.
From the monthly chart below, we can see where gold prices have been range-bound for the better part of the past two years, ever since topping in August of 2020. That top has now been tested twice, making for a double top formation. That formation had a neckline at the low between the two tops – which was that same level of 1671 that was traded through last week.
The big question now is whether sellers have follow-through with this week’s FOMC rate decision. Notice that gold prices are now working on their sixth consecutive monthly loss – which correlates with the Fed’s rising rate cycle, which began in March and has picked up steam along the way.
Gold Monthly Price Chart

Chart prepared by James Stanley; Gold on Tradingview
When the Levee Breaks
I’ve been talking about this for some time but during the two year range, gold prices have tested a really big zone of support numerous times and there’s a lot going on down there. I was tracking the zone from the 1700 psychological level down to the 1671 prior swing low. In between, there’s also a Fibonacci level of note at 1690 along with some other prior swing-lows. So, it’s a big zone that was already tested in July before a really strong reversal. That reversal was reversed ahead of Chair Powell’s speech at Jackson Hole and as the Fed has grown more and more clear with their plans, sellers have started to take on a more noticeable tone in gold.
Bears advanced the bearish theme in a big way last week by setting that fresh two-year-low. But there was a lack of follow-through and this provides complication for continuation approaches. And, perhaps more to the point, gold has traded in a very sharp manner this year, such as the early-September test at 1700 which led to an almost $50 rally in less than two weeks.
So, for bears, the path forward would appear to be either a) waiting on a pullback to resistance, which could re-open the door for shorts or b) looking to institute breakout logic on prints of fresh lows. For the former, there’s a series of nearby levels that could be of use for such. S of this writing, there’s a show of residual support at the 1671 level, which would also be a higher-low if it holds. This keeps the door open for a push up to 1690 or perhaps even 1700, both areas of support-turned-resistance.
If buyers are able to push out of the 1700 zone, then a greater recovery is underway and resistance potential then pops up at either 1717, 1731 or 1740, all swings of prior support that have shown some element of resistance so far.

Gold Four-Hour Price Chart
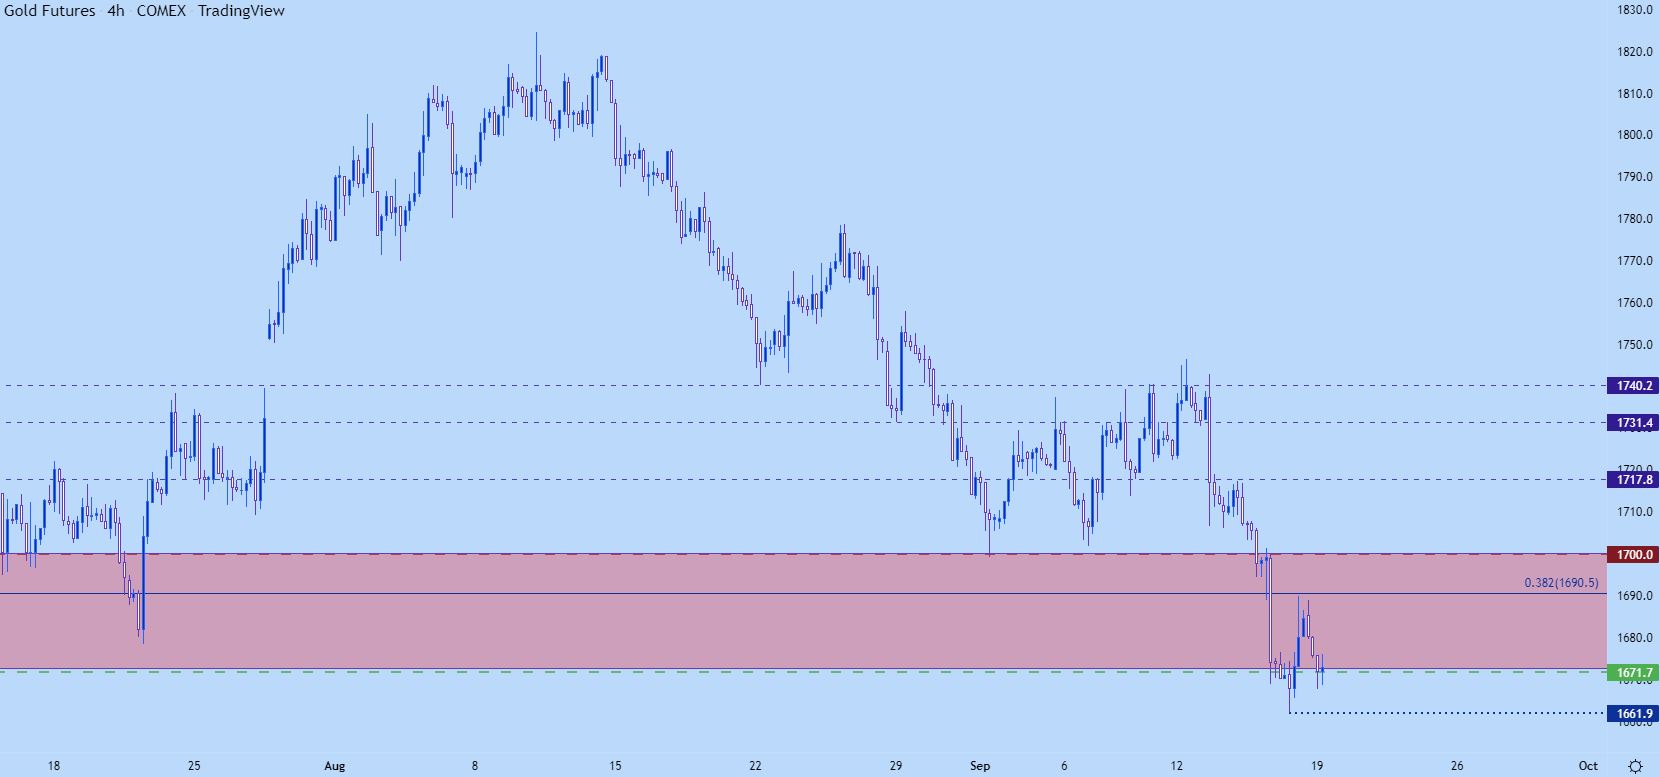
Chart prepared by James Stanley; Gold on Tradingview
--- Written by James Stanley, Senior Strategist, DailyFX.com & Head of DailyFX Education
Contact and follow James on Twitter: @JStanleyFX


