


US Dollar Talking Points:
- The US Dollar continues to hold support at the 103.82 spot, which was the 2017 high that came back into the equation two weeks ago.
- Many USD markets are exhibiting range which is not all too surprising given the holiday period. After nine months of an aggressive bullish trend and three months of aggressive pull back, the stage is set for a continuation of USD volatility into 2023 trade.
- The analysis contained in article relies on price action and chart formations. To learn more about price action or chart patterns, check out our DailyFX Education section.

The US Dollar has now held support for two weeks which, given the circumstances, can be considered an early win for bulls. The sell-off in Q4 was aggressive after a really strong topside run enveloped the US Dollar and related pairs through the first three quarters of the year.
This wasn’t just a US Dollar story, however, and if one merely evaluates the chart they may miss that point. Also playing into that theme was melting currencies in the UK and Europe, each of which make up a significant component of the DXY basket (57.6% for the Euro, 11.9% for the British Pound). As inflation was spiking in Europe and the UK and as the European Central Bank and the Bank of England were slow to respond, markets punished their currencies and when added with the higher rates out of the US, this made for fast bearish runs in EUR/USD and GBP/USD.
The high for the USD in 2022 came on the same morning that the British Pound collapsed. This happened in late-September after the unveil of a budget that caused some considerable political turmoil in the UK. But – as markets stepped back from the ledge and as GBP/USD recovered, the USD snapped back and this was led into a similar recovery move in EUR/USD, helped along as the ECB finally started to come to the table with rate hikes.
Inflation in Europe and the UK remains at over 10%. The hope is that in the US, CPI has topped and will continue to move-lower after a blistering pace of rate hikes in 2022. But, perhaps more importantly for next year, the ECB and BoE may not be as much flexibility as the FOMC, and this raises the question as to whether these bullish trends that sparked in Q4 in EUR/USD and GBP/USD have much potential for continuation. Below, I take a look at these questions from a longer-term lens.
US Dollar
The US Dollar has found support at the 103.82 level which was the swing high in 2017. This price provided some resistance when DXY was breaking out in April, albeit temporary, before coming in as support in June just before the USD launched up to a fresh 20-year-high.
This level started to come back into the picture a couple of weeks ago, right after the CPI print that helped to bring a reversal move in stocks, which is still pricing in today. The dollar has since come back to this price to test the lows on multiple occasions, illustrated on the below weekly chart in the red box.
US Dollar Weekly Price Chart
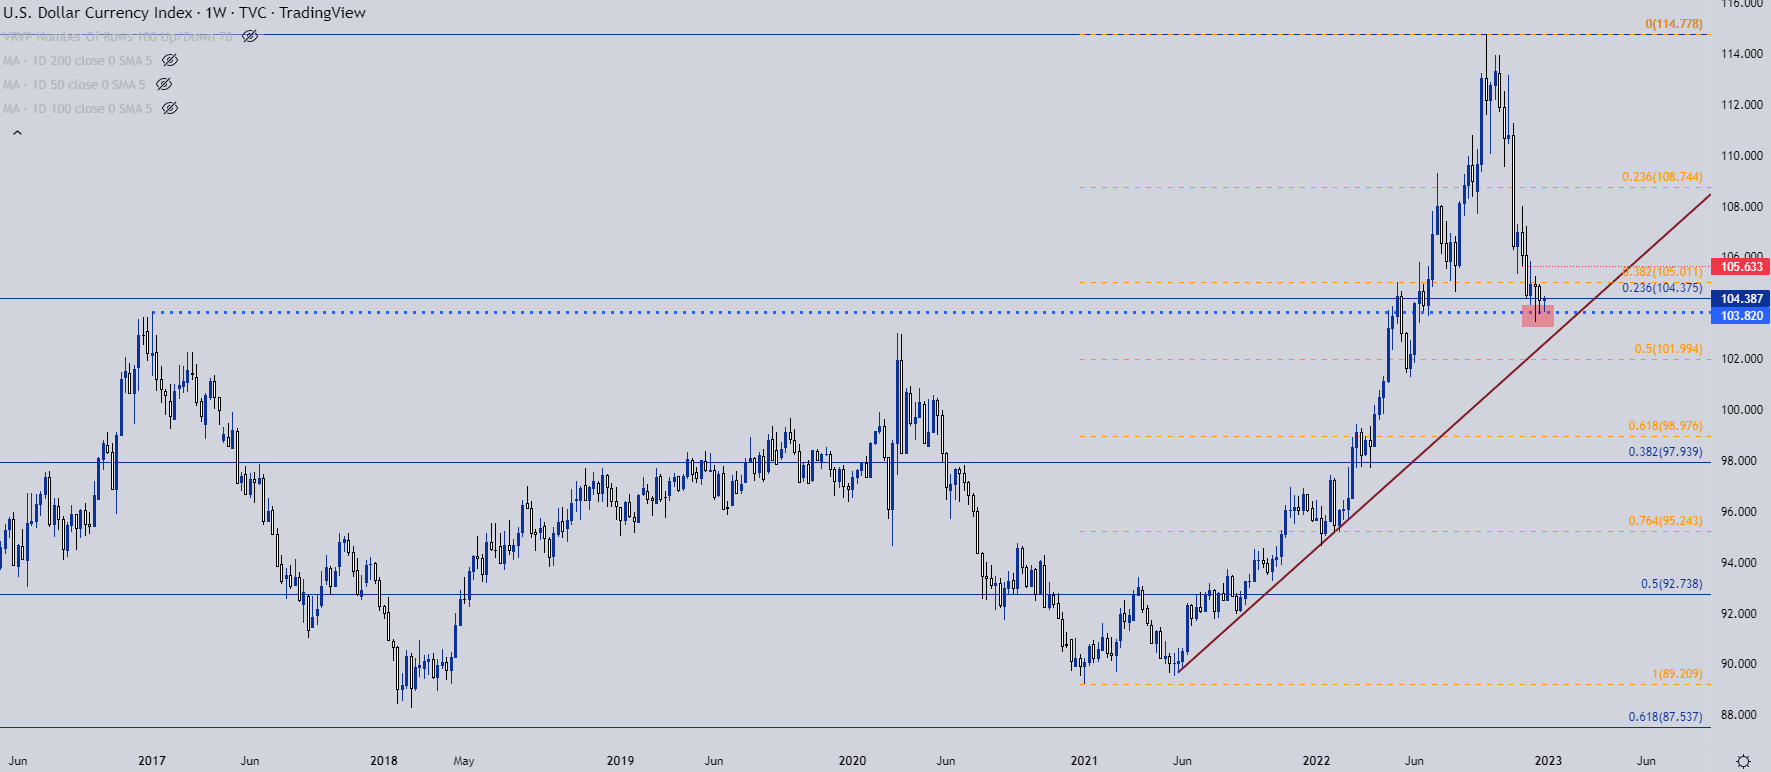
Chart prepared by James Stanley; USD, DXY on Tradingview
USD Longer-Term
Taking a step back, this pullback has the appearance of correction in a bigger-picture bullish theme. This is supported by the 23.6% Fibonacci retracement of the 2008-2022 major move, which is confluent with a bullish trendline projection taken from swing lows in 2021 and 2022, and of course that prior swing high from 2017 that comes in at 103.82.
US Dollar Monthly Chart
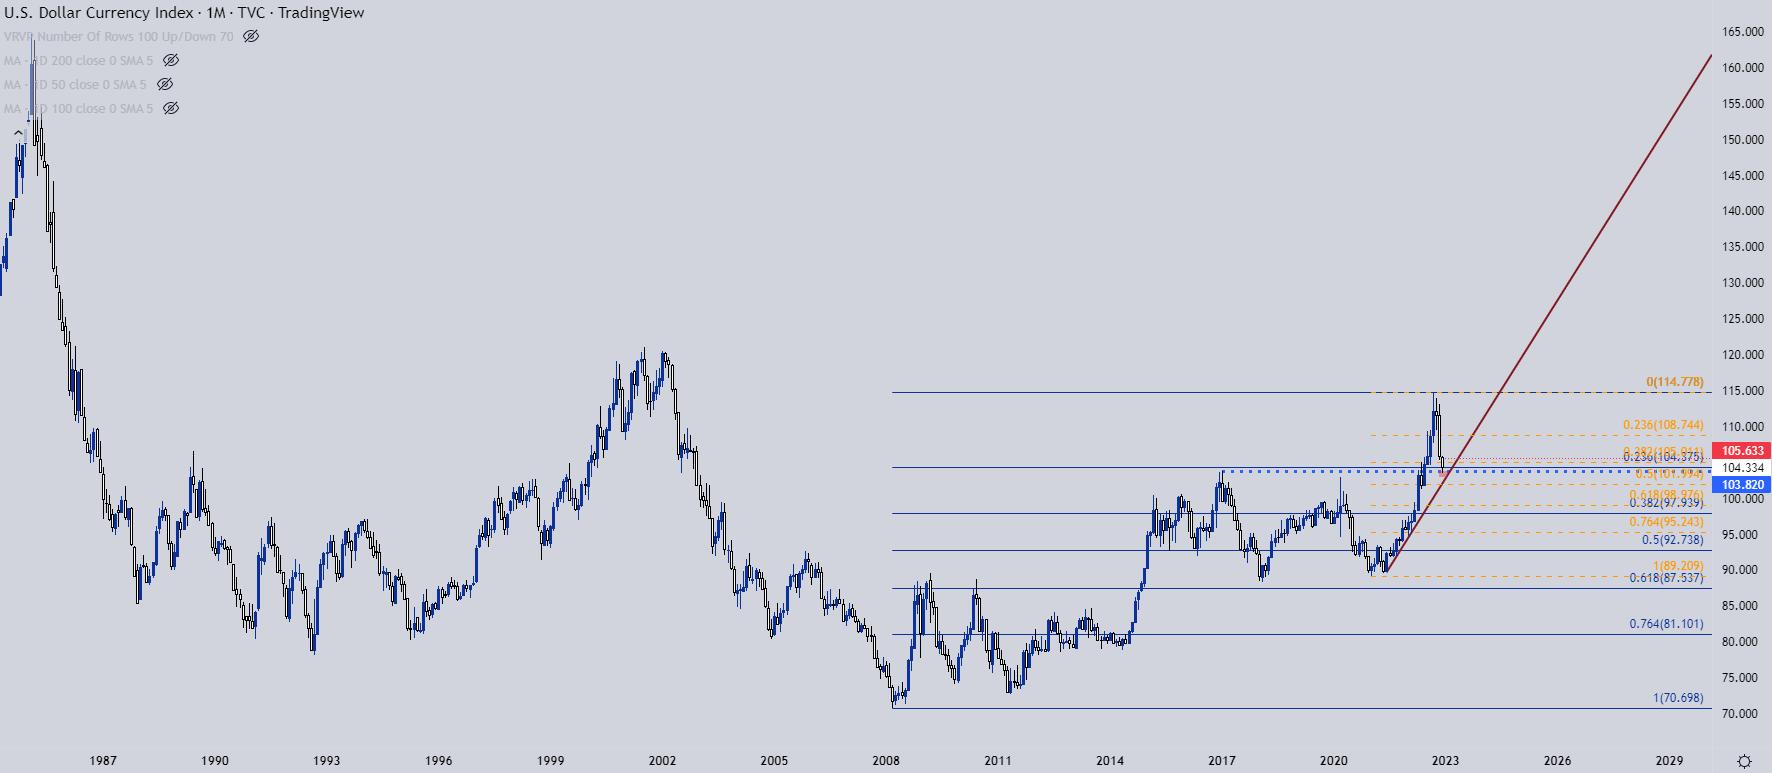
Chart prepared by James Stanley; USD, DXY on Tradingview
EUR/USD
As noted above EUR/USD is a whopping 57.6% of the DXY quote so it’s going to be difficult for the US Dollar to go anywhere without at least some participation from the Euro.
In 2022 that was very much key, as a precipitous drop in the single currency was a major contributing factor to the spike in the USD. Perhaps more problematic was the lack of support at the parity handle, which did help to buffer the lows for a couple of months but soon gave way to sellers.
A low finally was set in September around the .9594 level, which was a swing-high-turned-support from back in 2001. There was such a dearth of historical action in this region and something as simple as a prior swing was able to come-in to help demarcate the lows. The bounce that’s showed in November and December came from deep oversold conditions on a long-term basis and at this point, resistance has held from a prior spot of support, around 1.0750, questioning whether the pullback has run its course.
EUR/USD Monthly Price Chart
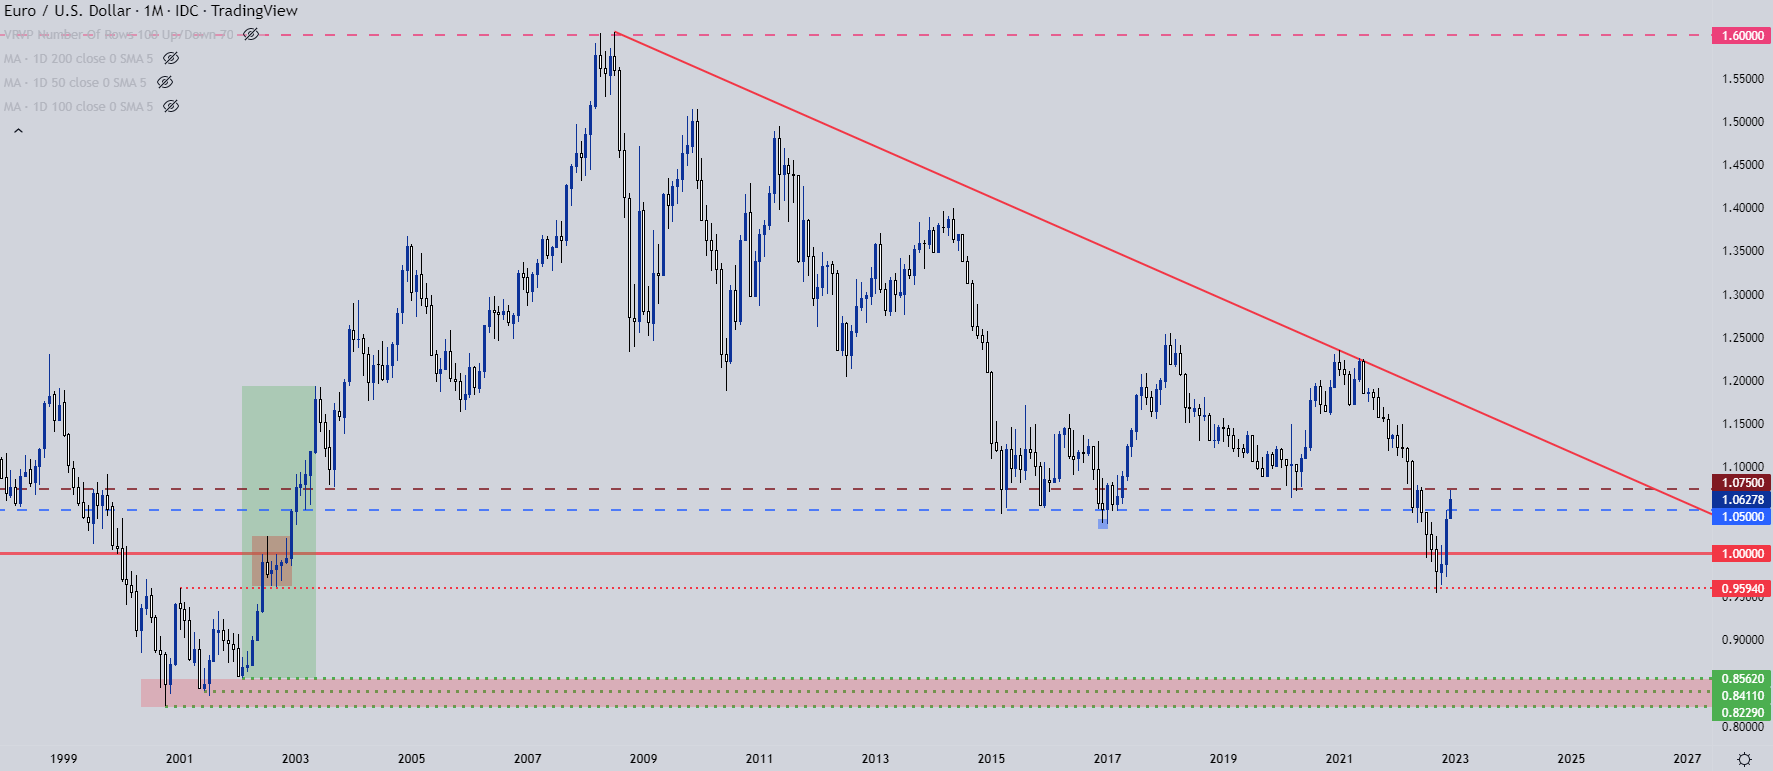
Chart prepared by James Stanley; EURUSD on Tradingview
GBP/USD
The British Pound came into Q4 on its back foot. The currency went into collapse-like mode in late-September and Q4 was largely a period of recovery from that. In less than three months, GBP/USD erased more than 50% of the sell-off that began in May of 2021. The 50% marker of that move is at 1.2303 and it set resistance in GBP/USD over a three-week-period in late-November and early-December. The corresponding pullback has so far held at the 1.2000 psychological level and from a short-term basis, a hold of support there can keep the door open for topside swings. But, if it fails, there's a lot of room for price to run-lower in breakdown scenarios.

GBP/USD Weekly Price Chart
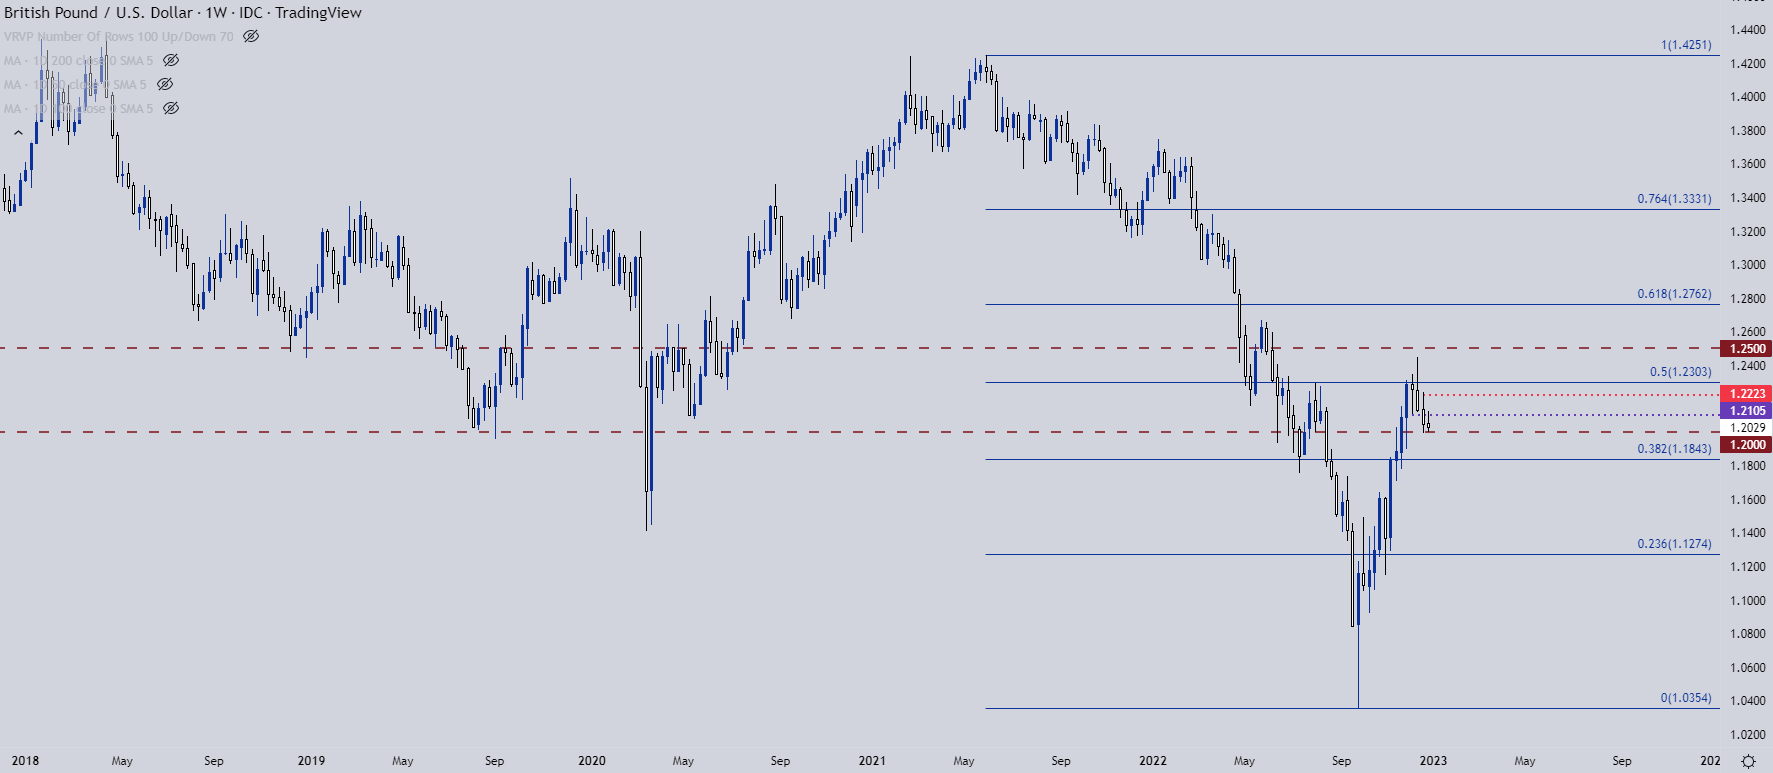
Chart prepared by James Stanley; GBPUSD on Tradingview
USD/CAD
First things first, USD/CAD is in a long-term range and I think this is notable as something like this can have immense impact on short-term swing dynamics. Below, the monthly chart highlights this mean reversion that’s been going on for more than seven years now.
USD/CAD Monthly Chart
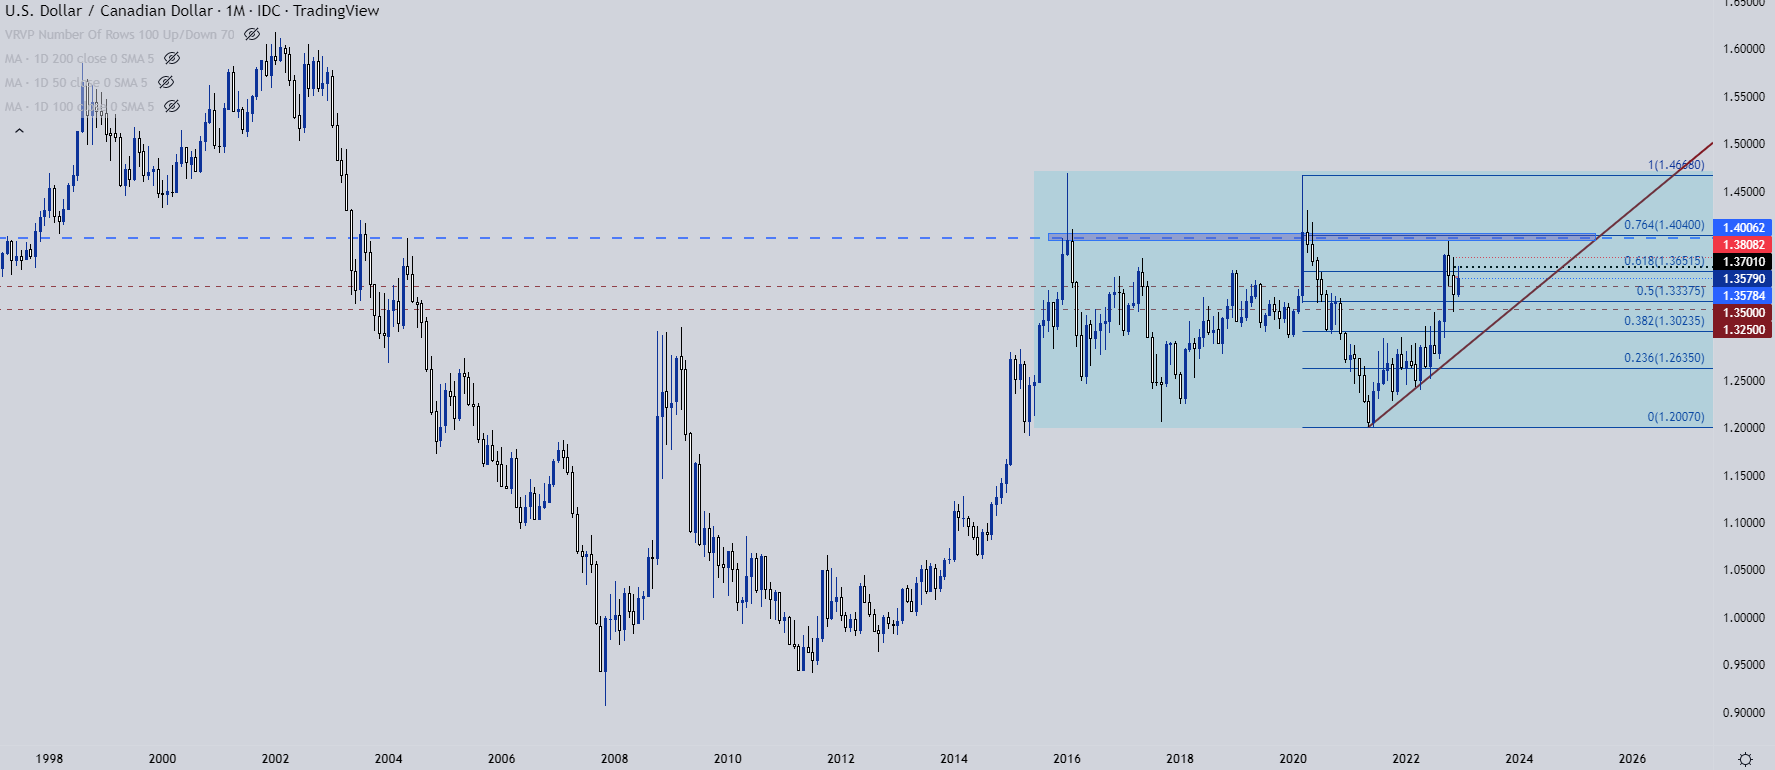
Chart prepared by James Stanley; GBPUSD on Tradingview
USD/CAD Shorter-Term
On a shorter-term basis, USD/CAD has been teasing breakout for the past few weeks with nothing taking hold yet. There was a build of resistance at 1.3700 which held multiple inflections and yesterday, prices pushed down to the 1.3500 level before a bounce showed. That bounce has since pushed up to resistance at prior short-term support so on a shorter-term basis, the matter remains messy.
More importantly, however, is if we zoom out we’ll notice the continued build of lower-highs after price failed to test above the 1.4000 level, and then set resistance at 1.3808 and then the continued build at 1.3700.
This puts the onus to defend the lows on bulls and, if they don’t, bigger picture reversal themes could come into the equation next year, looking for price to move-lower in the longer-term range formation.
USD/CAD Daily Price Chart
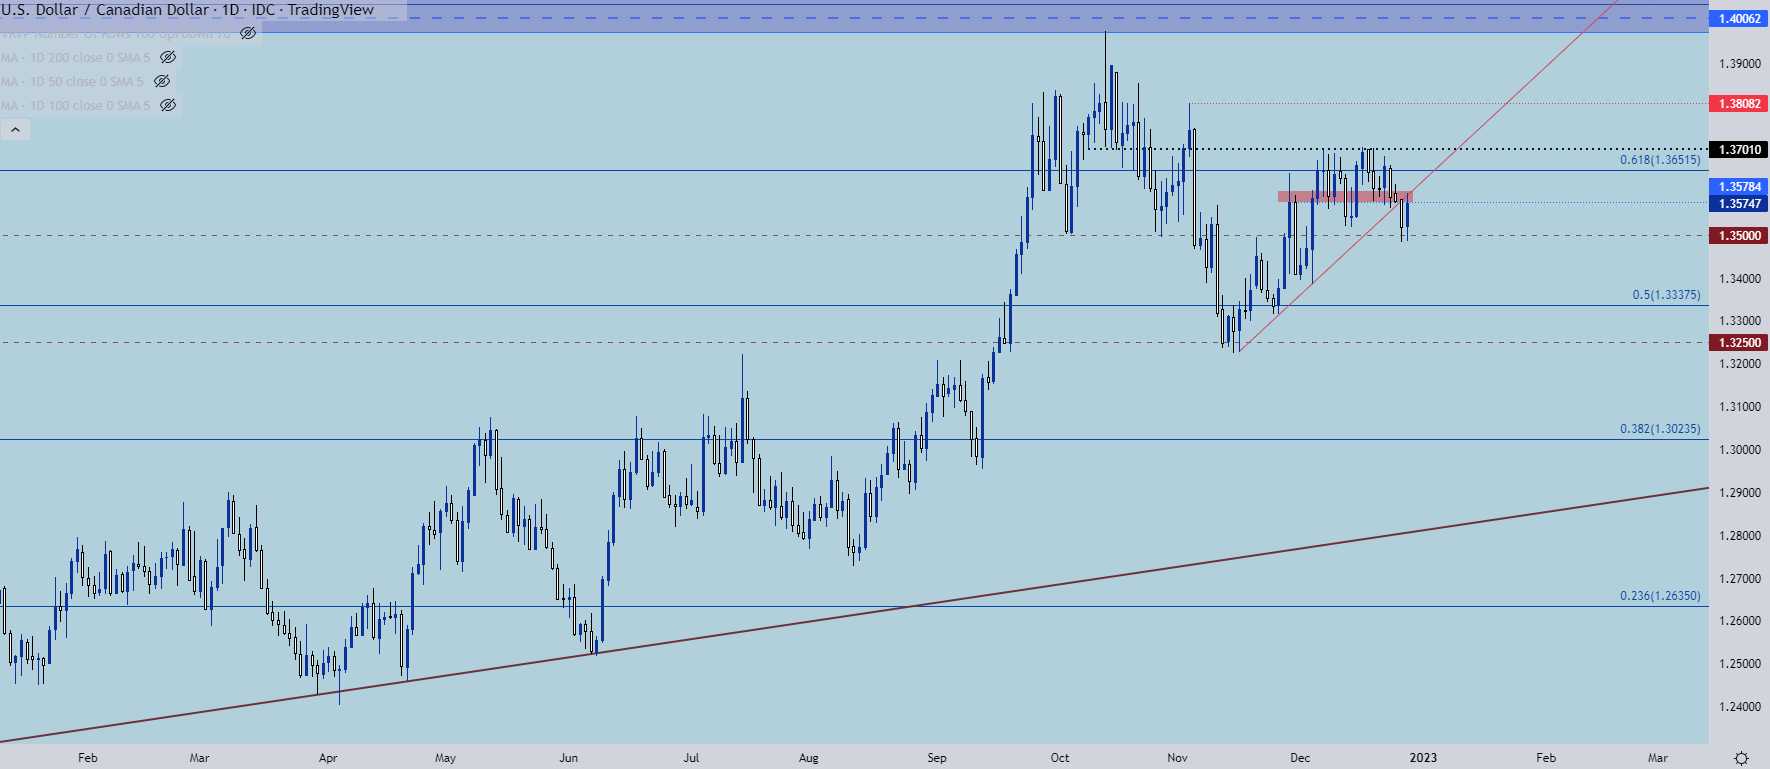
Chart prepared by James Stanley; USDCAD on Tradingview
USD/JPY
Can the BoJ keep up their pedal-to-the-floor policy through the end of 2023? With inflation spiking up to 40-year highs and with a leadership change set to take place atop the BoJ, that’s a difficult prospect to accept at this point. But, any changes are wrought with risk so the big question remains ‘how’ the Bank of Japan might navigate a situation that’s surely to carry downside with any option that they choose.
This year saw USD/JPY spike up to fresh 32-year highs, to levels that haven’t been traded at since 1990. There was little tolerance for prices above the 150.00 psychological level, however, as prices quickly retreated after a test there in October. The continued pullback from that level ran all the way down to longer-term support at the 131.25 level that had set a double top formation in April.
USD/JPY Monthly Price Chart
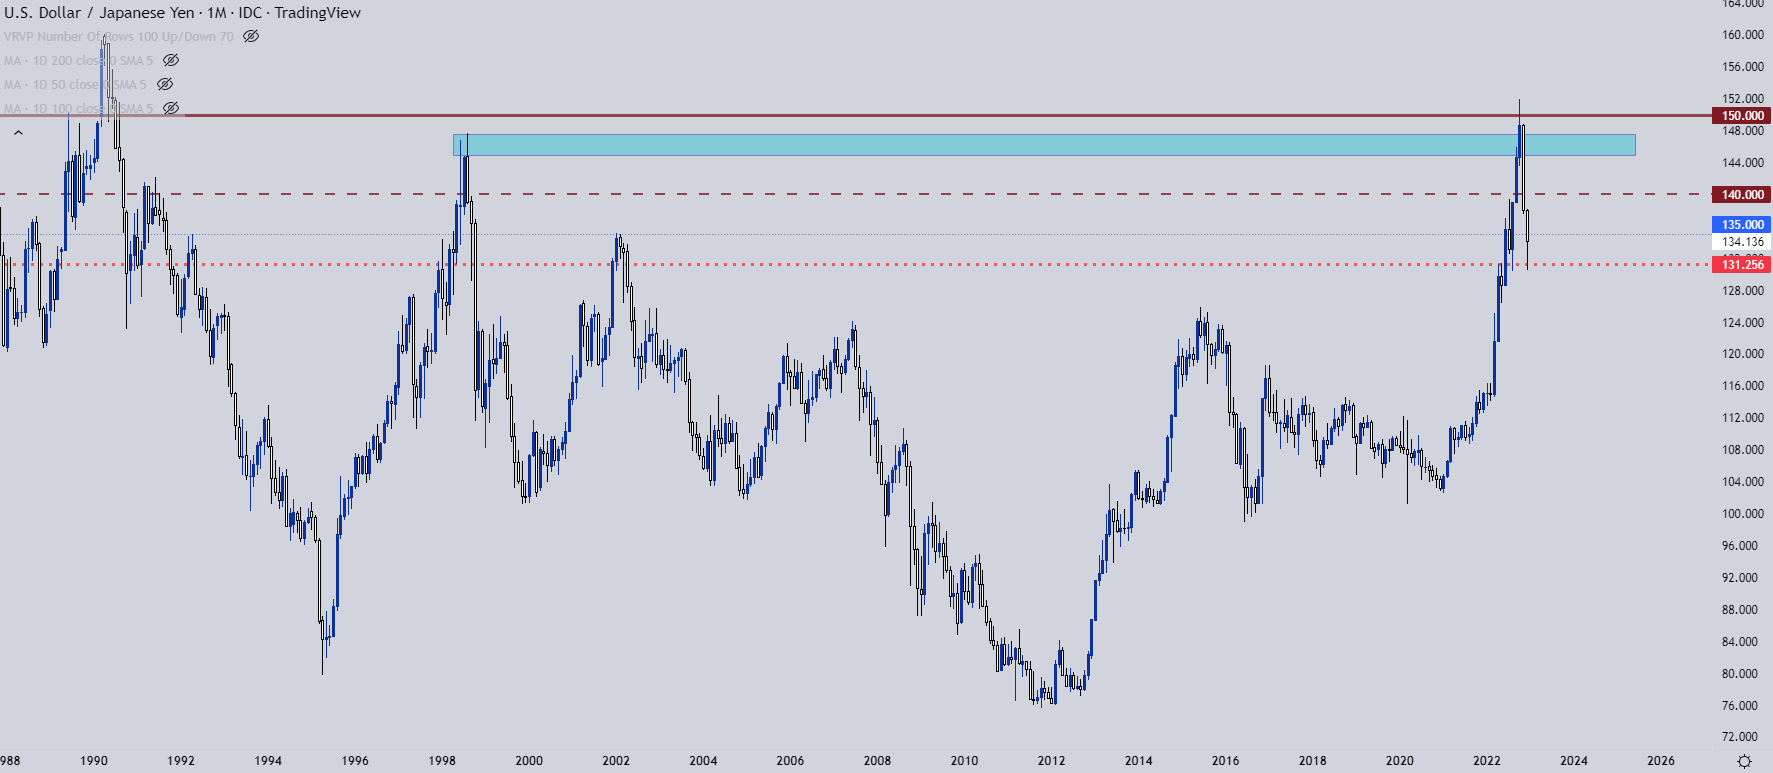
Chart prepared by James Stanley; USDJPY on Tradingview
USD/JPY Shorter-Term
At this point, the 131.25 level has provided a bit of a bounce but the onus is still on bulls to protect that low above the 130.00 handle. I wouldn’t quite call the below setup a head and shoulders pattern, but it has similar leanings as there’s a spot of support that’s come back into the equation after a spiked breakout fell flat.
This would, at the least, keep that support as somewhat vulnerable until bulls showed a greater response, and re-crossing above the 135.00 level would be an ideal first step, after which a spot of resistance from prior support shows around the 138.00 handle.

USD/JPY Daily Price Chart
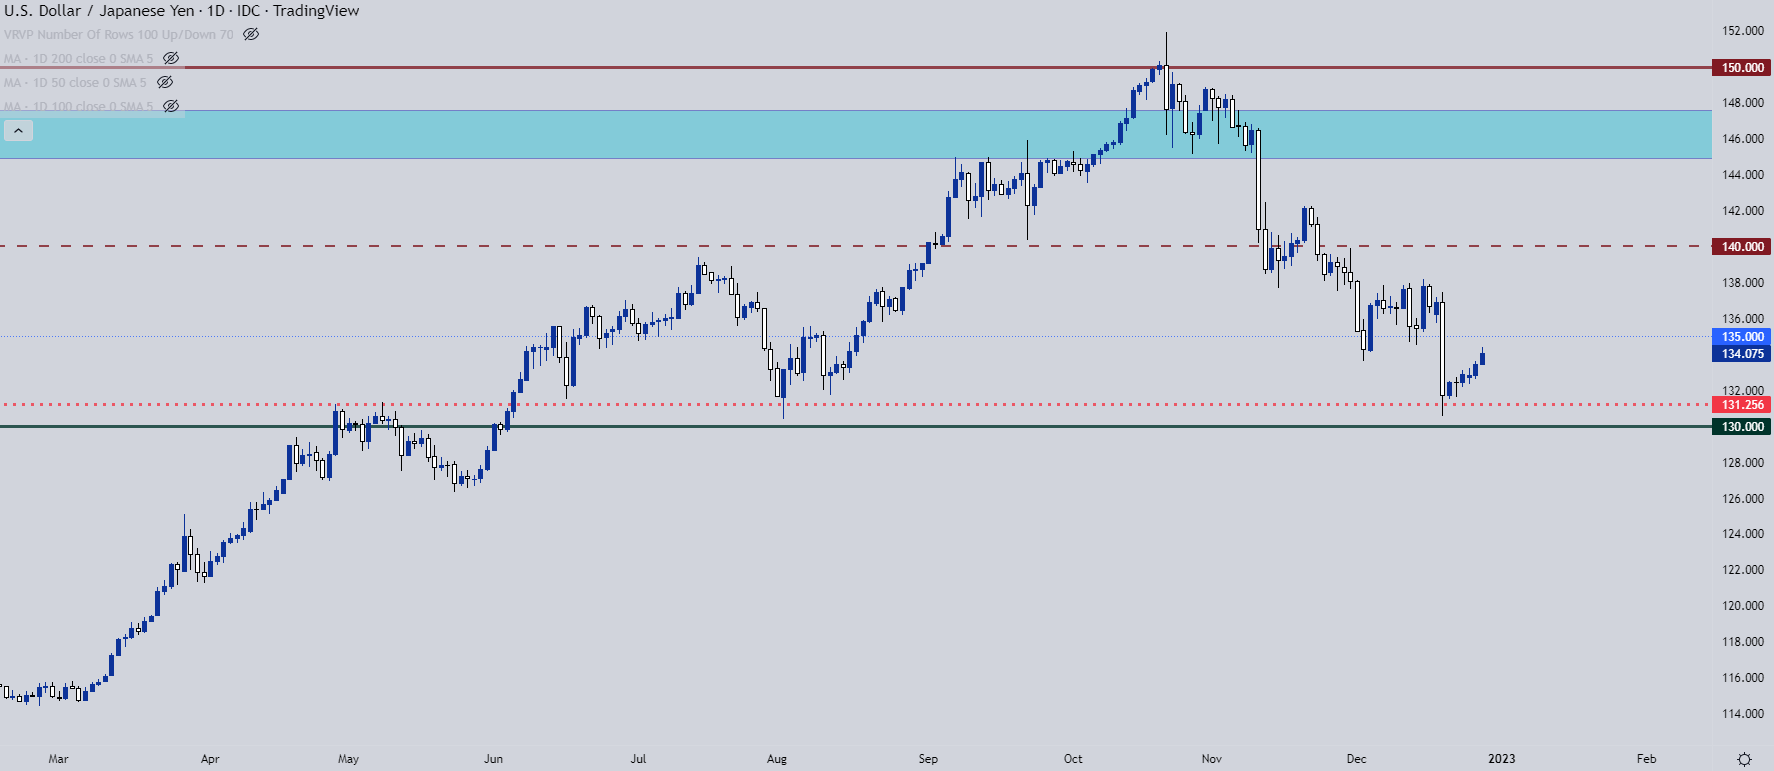
Chart prepared by James Stanley; USDJPY on Tradingview
--- Written by James Stanley
Contact and follow James on Twitter: @JStanleyFX


